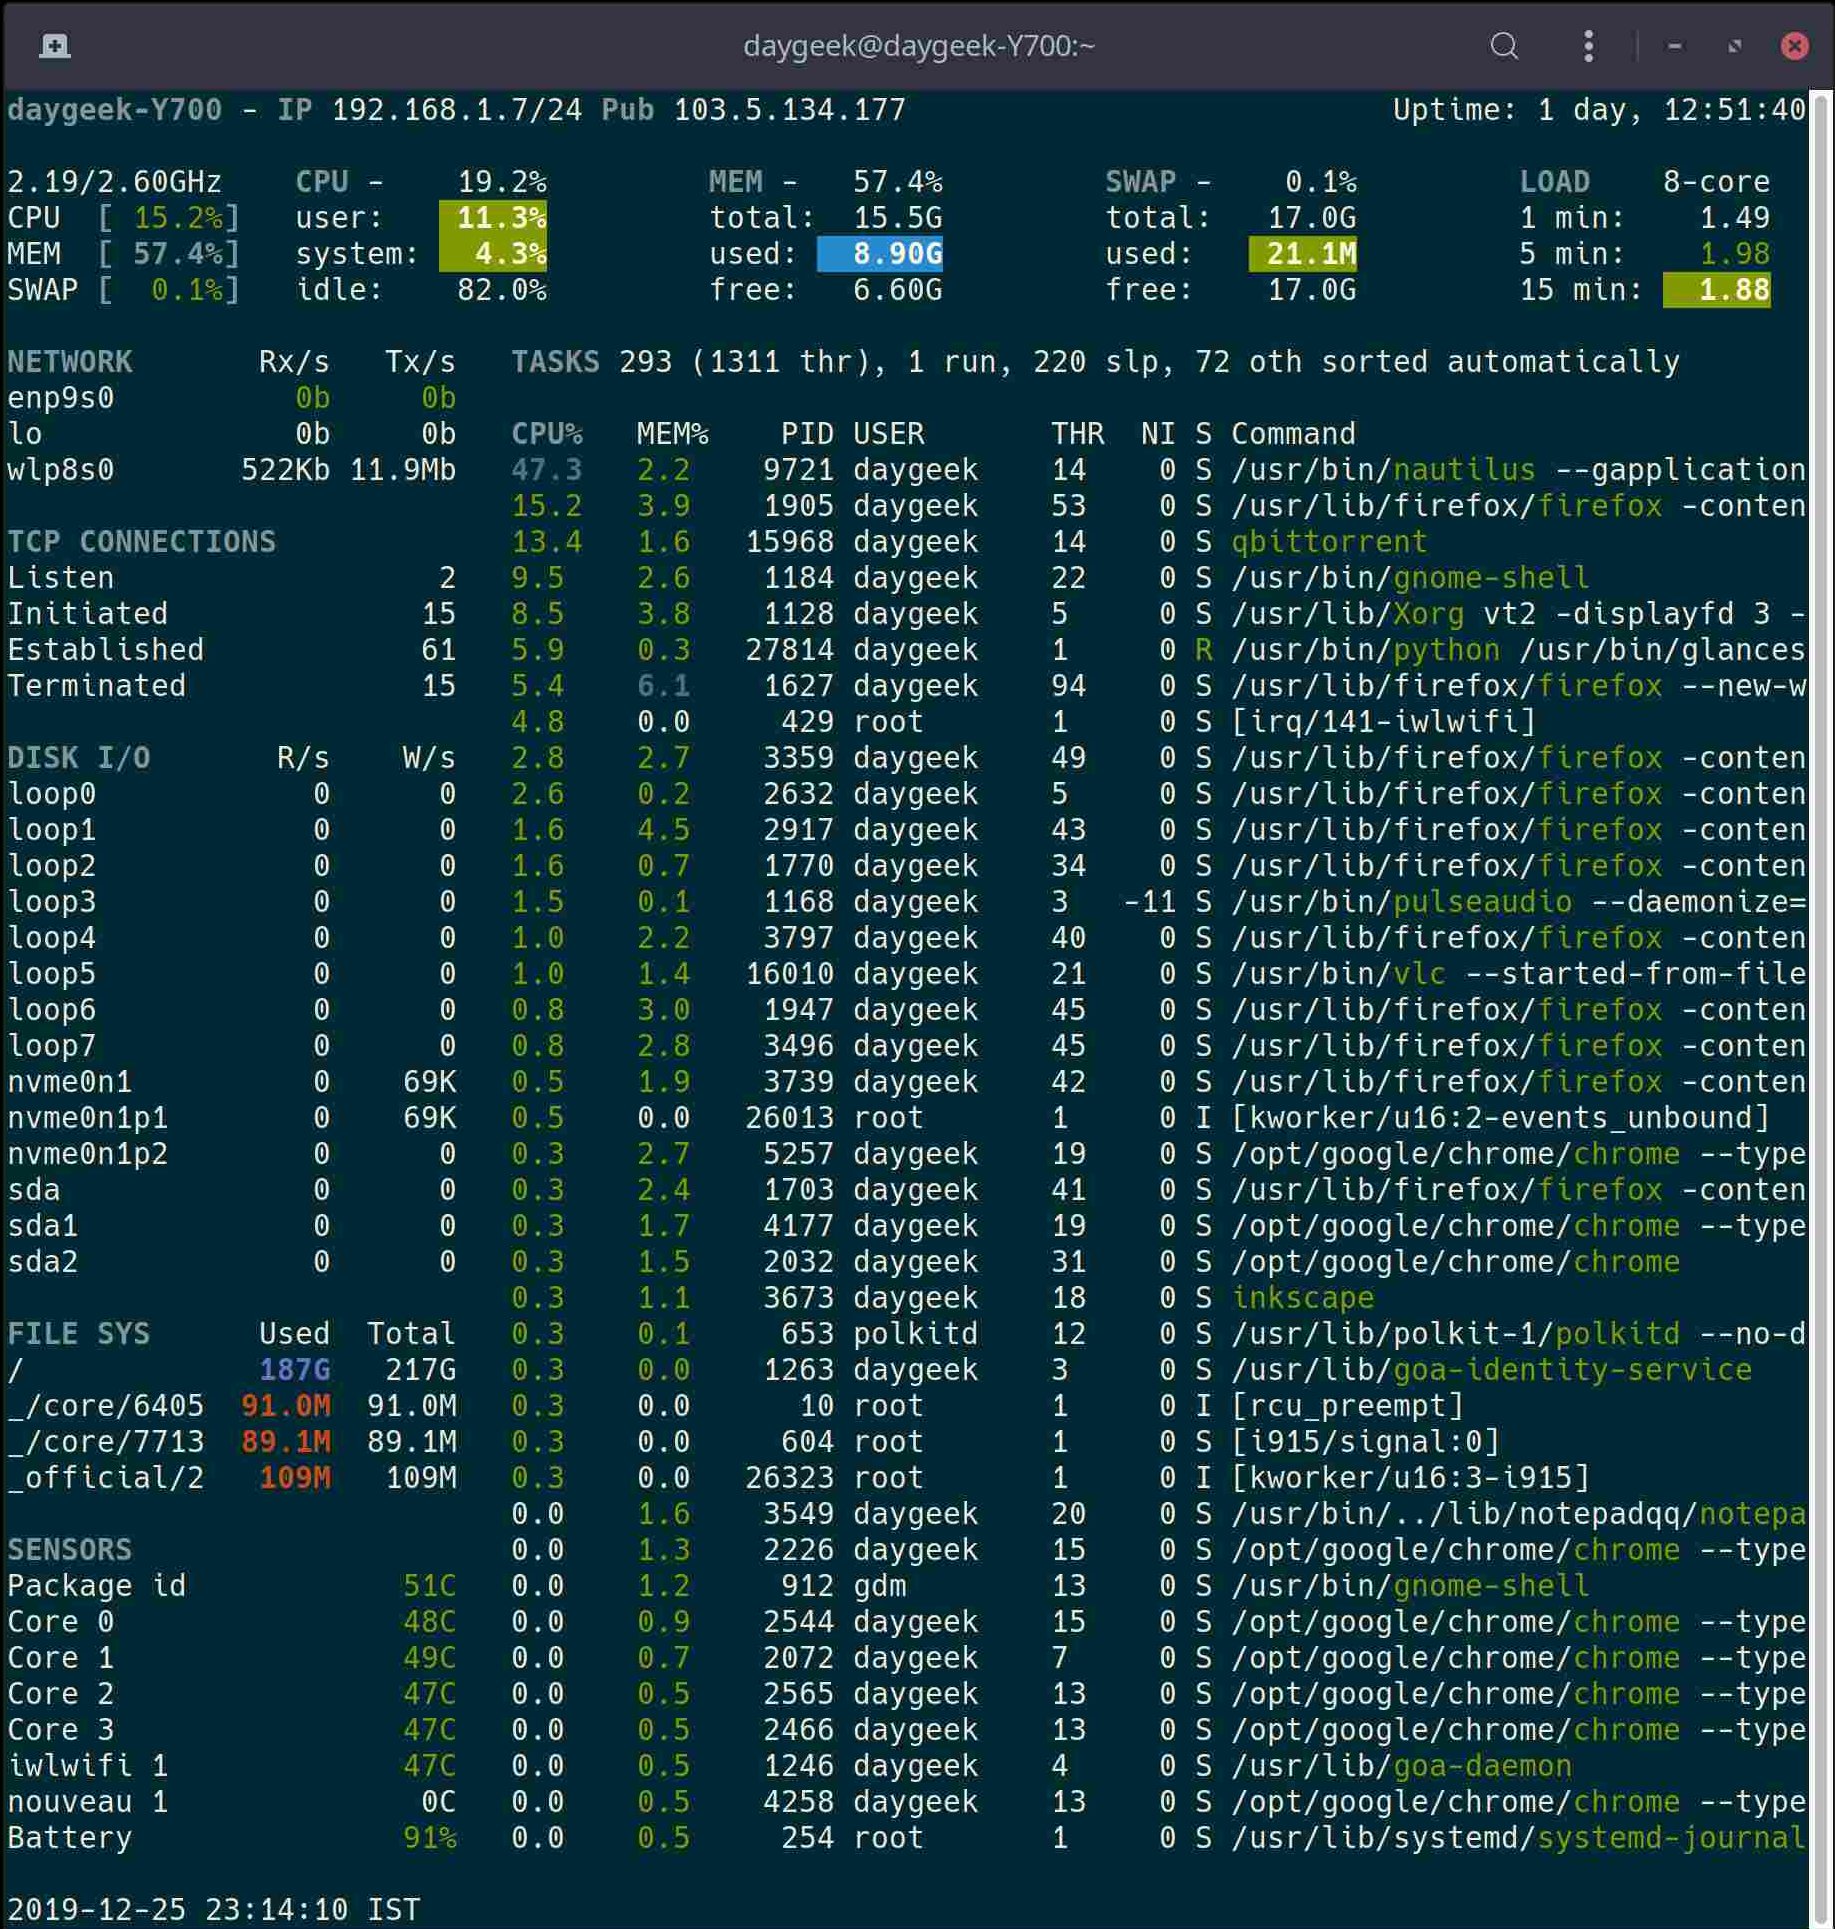
Glances is a cross-platform curses-based system monitoring tool written in Python.
It uses the psutil library to retrieve information from your system.
It’s accommodating all in one place, It shows a maximum information in a minimal space through curses or a web-based interface.
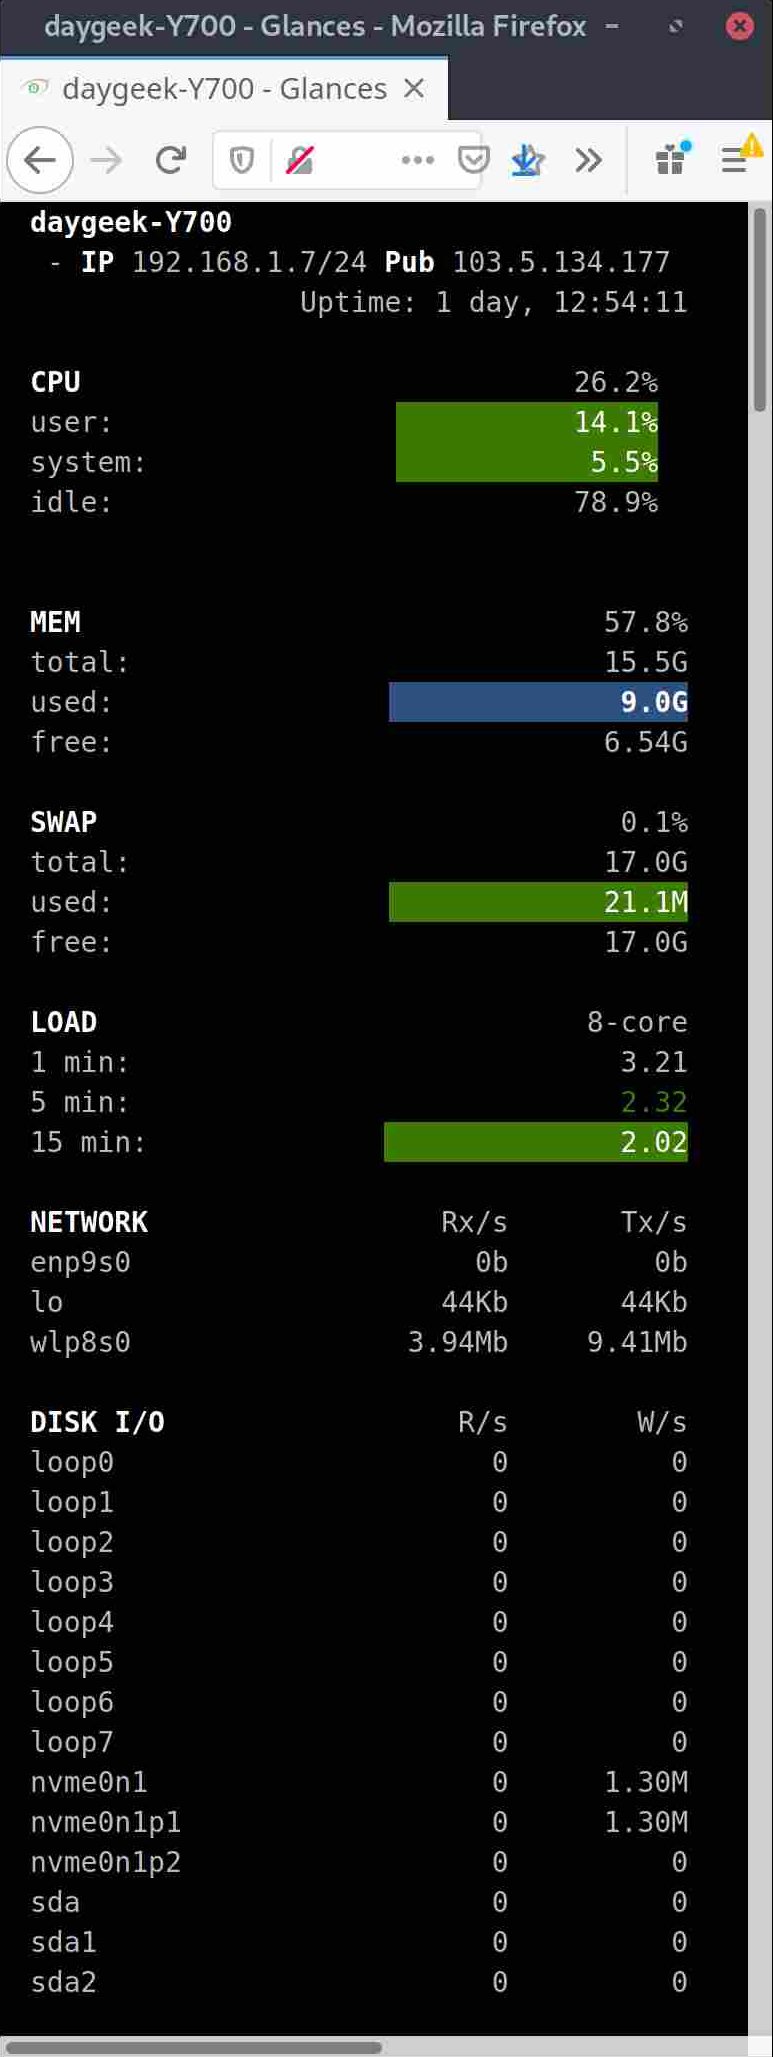
The information dynamically adapts depending on the size of the user interface.
This is a best alternative to top/htop utility on GNU/Linux.
Glances is capable to monitor CPU usage, Memory usage, Swap usage, System Load Average, Process list, Network interface, Disk I/O, Raid, Sensors (CPU temperature), Battery, Filesystem Usage, Docker, Monitor, Alert, System info, Uptime, etc.,.
It can also work in client/server mode. Remote monitoring could be done via terminal.
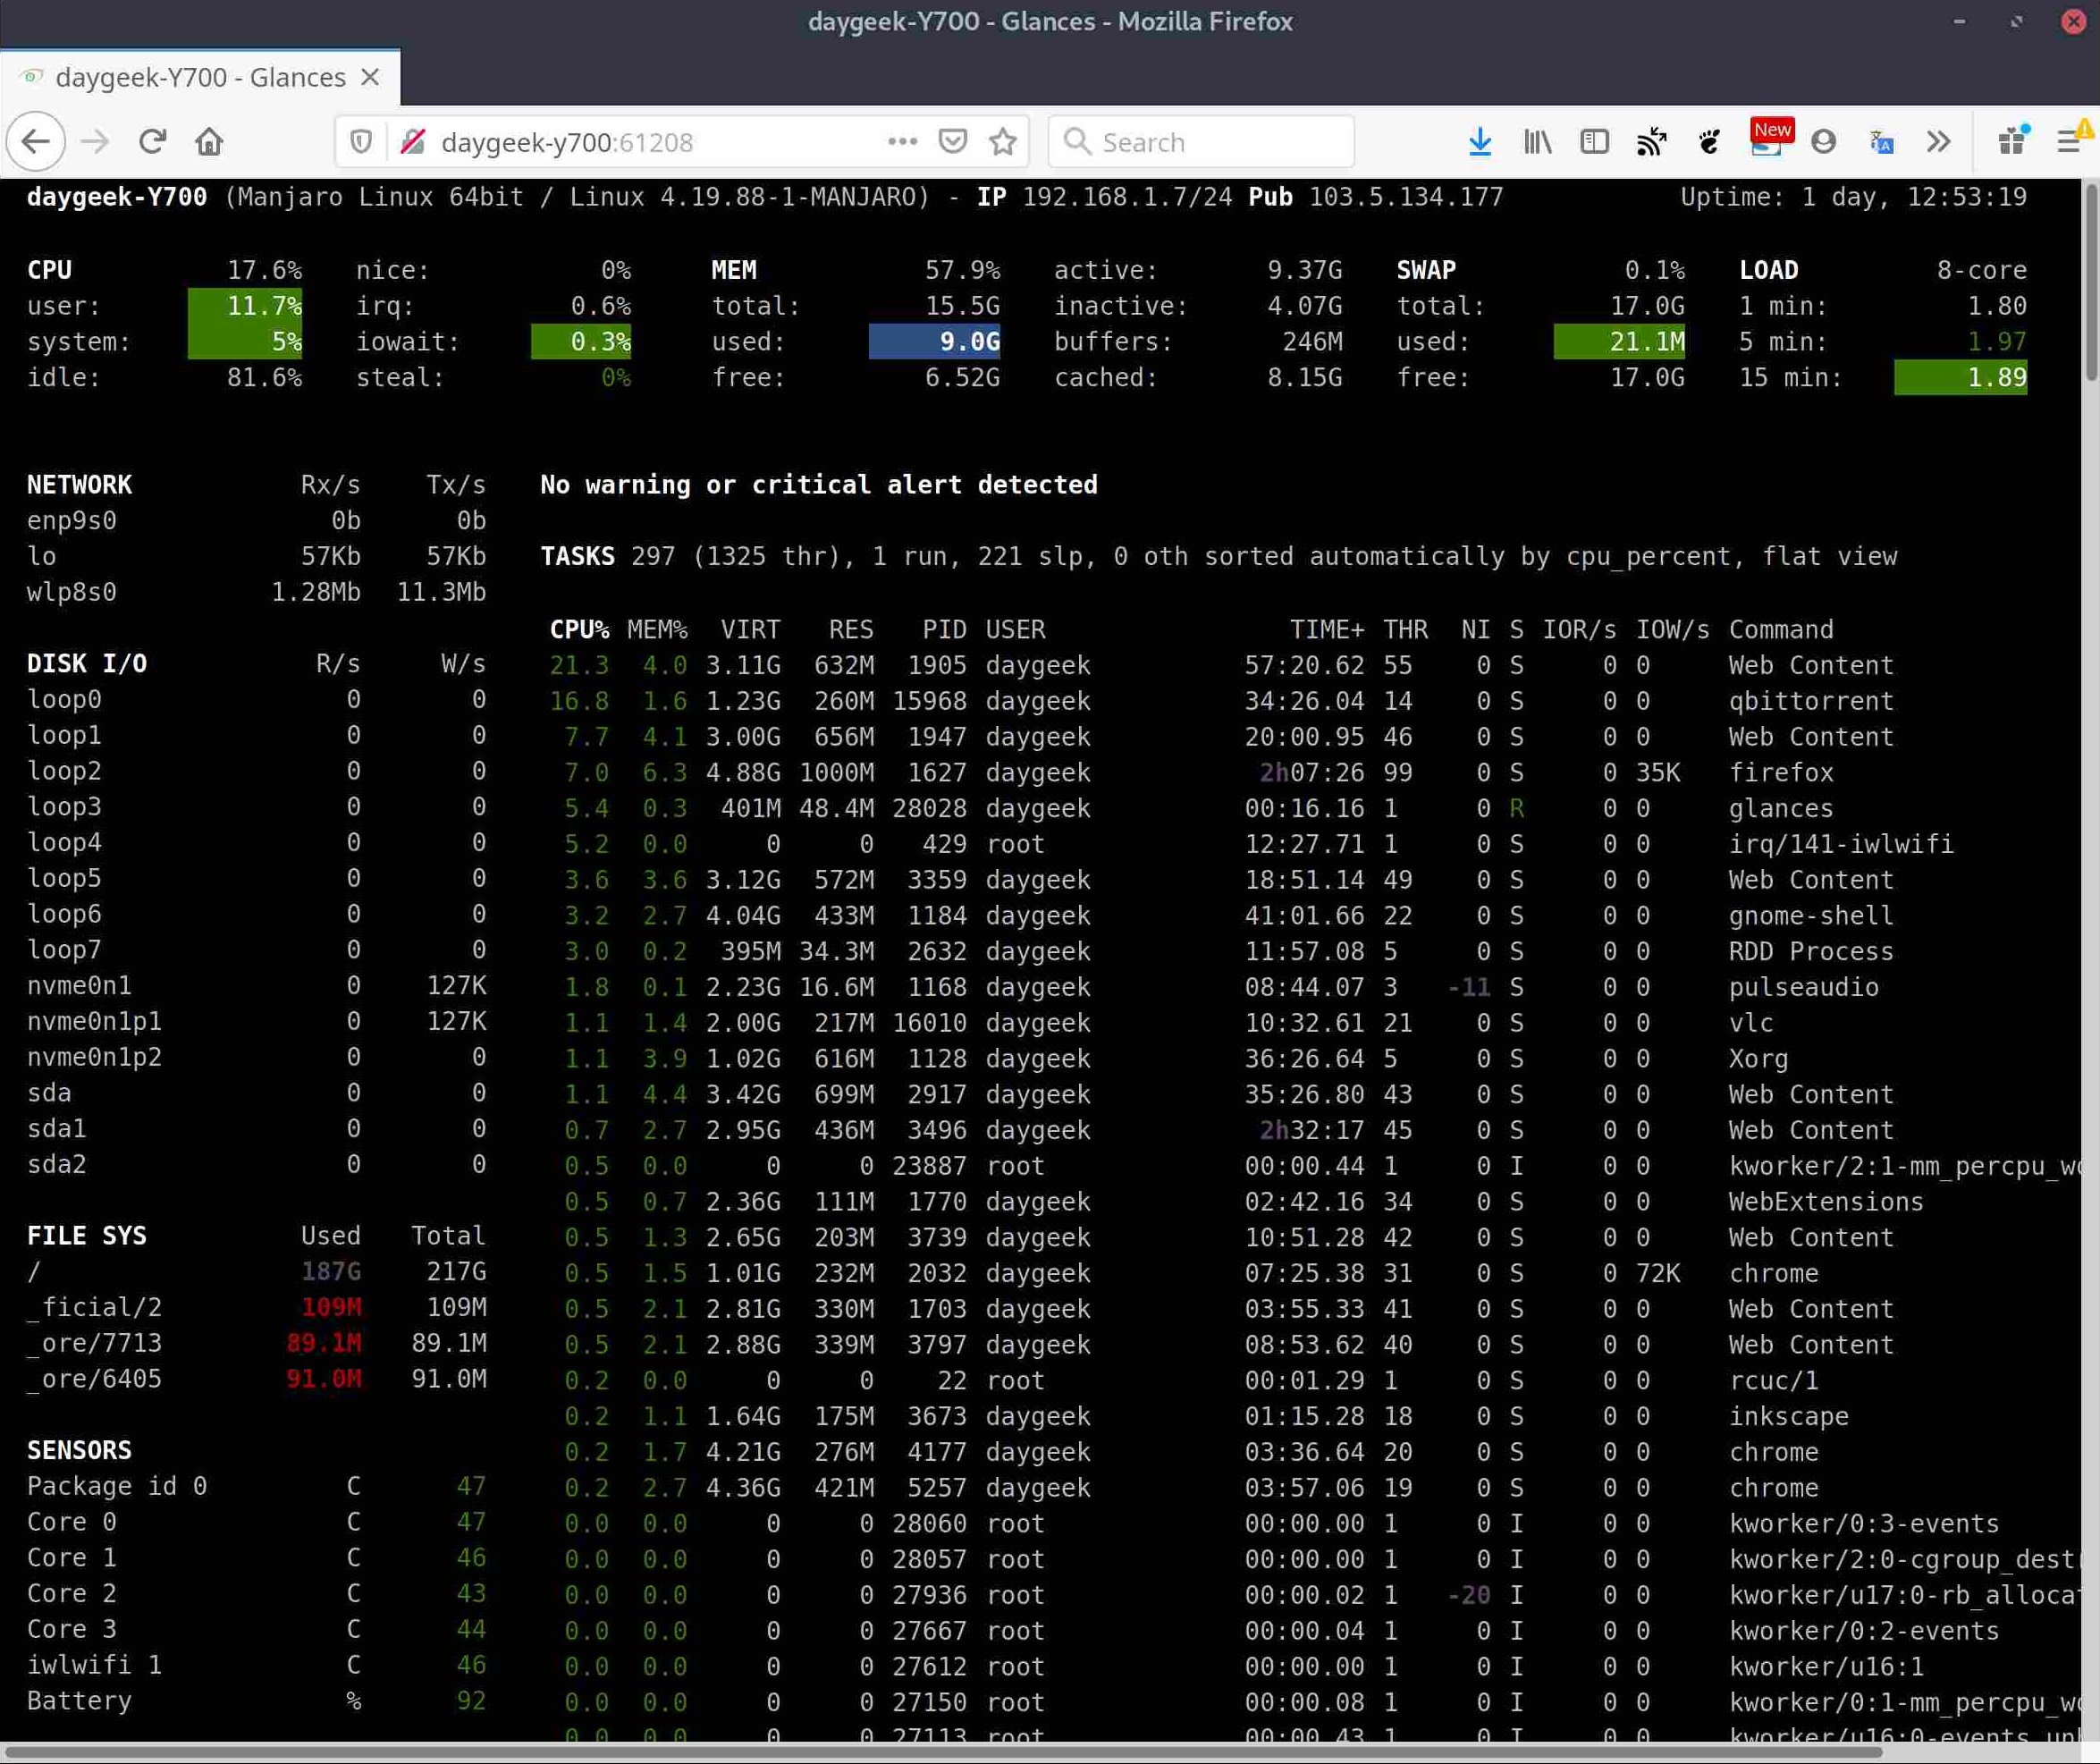
Alternatively, you can monitor system performance through the built-in web user interface, and through the mobile interface.
You can export all system statistics to CSV, StatsD, InfluxDB, ElasticSearch or even RabbitMQ.
Glances also provides a dedicated Grafana dashboard.
By default the view limitations are configured as follows (careful= 50, alert= 70 and critical= 90) and you can adjust according to your requirements. The glances configuration file is located in /etc/glances/glances.conf.
Glances Color Codes:
- GREEN : Ok
- BLUE : Careful
- VIOLET : Warning
- RED : Critical
Method-1: How to Install Glances on Linux Using the Glances Auto Installation Script
You can easily install the Glances using the Glances Auto Installation Script that supports all modern Linux distributions. This will automatically install all the dependencies required by the Glances. To do so, shoot the command below on your terminal.
Run the following command to install Glances using the curl command.
# curl -L https://bit.ly/glances | /bin/bash
Run the following command to install Glances using the wget command.
# wget -O- https://bit.ly/glances | /bin/bash
Method-2: How to Install Glances on Linux Using PIP Command
Glances is on PyPI, so you can easily install through pip. The pip package manager is a modern python module bundled with setuptools, it’s one of the recommended tool for installing Python packages in Linux.
Install Glances using pip.
# pip install glances
Install the following libraries in order to use optional features (like the Web interface, export module,ext):
# pip install glances[all]
or
# pip install 'glances[action,browser,cloud,cpuinfo,docker,export,folders,gpu,graph,ip,raid,snmp,web,wifi]'
Run the following commands to upgrade Glances and all its dependencies to the latest versions:
# pip install --upgrade glances
# pip install --upgrade psutil
# pip install --upgrade glances[all]
Method-3: How to Install the Glances on Linux From the Distribution Repository
Alternatively, using the Distribution Package Manager, you can install the Glances from the official repository on Linux distribution such as Debian, Ubuntu, Linux Mint, Fedora, Centos, Arch Linux, Manjaro and FreeBSD.
For Fedora system, use DNF Command to install glances.
$ sudo dnf install glances
For Debian/Ubuntu systems, use APT-GET Command or APT Command to install glances.
$ sudo apt install glances
For Arch Linux based systems, use Pacman Command to install glances.
$ sudo pacman -S glances
For RHEL/CentOS systems, use YUM Command to install glances.
$ sudo yum install glances
For openSUSE Leap system, use Zypper Command to install glances.
$ sudo zypper install glances
For FreeBSD
# pkg install py27-glances
How to Launch the Glances
Run the following command to launch the glances in a standalone mode.
# glances
For the Web server mode, run the below command and enter the URL http://
# glances -w &
For mobile interface.
Glances Options
Glances is offering several command line options, see the list below.
aSort processes automaticallybBytes or bits for network I/OcSort processes by CPU%lShow/hide alert logsmSort processes by MEM%wDelete warning alertsuSort processes by USERxDelete warning and critical alertspSort processes by name1Global CPU or per-CPU statsiSort processes by I/O rateIShow/hide IP moduletSort processes by TIMEDEnable/disable Docker statsdShow/hide disk I/O statsTView network I/O as combinationfShow/hide filesystem statsUView cumulative network I/OnShow/hide network statsFShow filesystem free spacesShow/hide sensors statsgGenerate graphs for current history2Show/hide left sidebarrReset historyzEnable/disable processes statshShow/hide this help screen3Enable/disable quick look pluginBCount/rate for Disk I/OeEnable/disable top extended stats5Show/hide top menu (QL, CPU, MEM, SWAP and LOAD)/Enable/disable short processes name0Enable/disable Irix process CPUqQuit (Esc and Ctrl-C also work)
Enjoy…)