Disk IO issues (input/output) are one of the most common causes of poor performance on Linux system.
This occurs when applications try to quickly read or write too much data on storage device such as hard drives, SAN & NAS, which forces applications and users to wait.
top command can be used to see if the CPU is waiting for disk operations to complete. The 'wa' metric shows IO-wait, which is the amount of time the CPU spends waiting for IO completion shown as a percentage.
In this guide, we will explain how to use various Linux commands to identify disk IO performance issues.
The below six commands are most useful when troubleshooting or monitoring real-time disk activity on Linux.
- iotop
- iostat
- vmstat
- atop
- dstat
- ioping
1) iotop
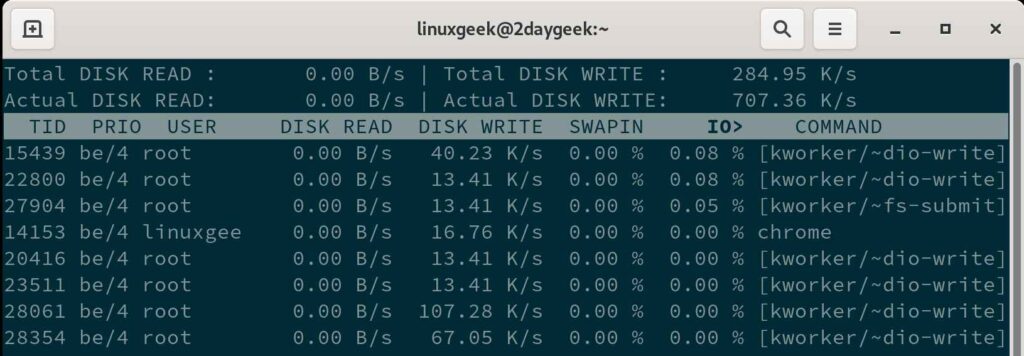
iotop is a top-like utility for displaying real-time disk I/O performance, which actually display a list of processes that perform I/O. Run the iotop command with '--only or -o' option to see the disk I/O activity as shown below:
# iotop --only
Details:
- o : Only show processes or threads actually doing I/O
2) iostat
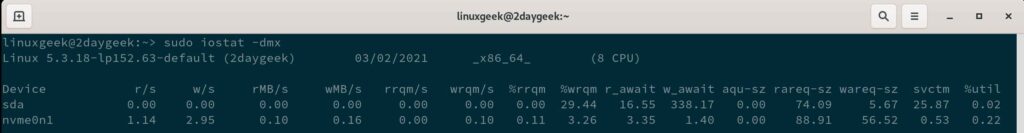
iostat command is used for monitoring system input/output statistics for devices and partitions. It monitors system I/O by observing the time the devices are active in relation to their average transfer rates.
It comes with various information that are related to disk I/O, which can be seen by running the below command:
# iostat -dxm
Details:
- x : Show more detailed statistics information.
- d : Display only the device report.
- m : Display statistics in MB.
3) vmstat
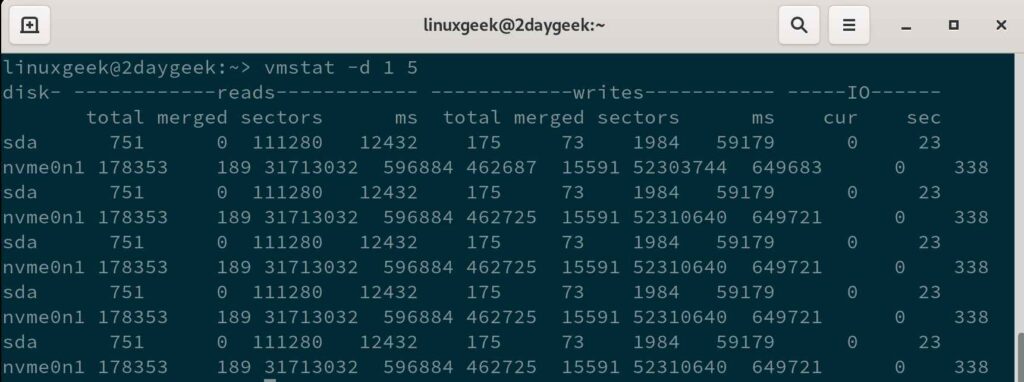
vmstat command stands for virtual memory statistics. It is a performance monitoring command, which also provides information about block IO and CPU activity in addition to memory.
The first line of the report will contain the average I/O values since the last reboot and the subsequent lines show real-time statistics as shown below:
# vmstat -d 1 5
Details:
- d : Display only the disk statistics
- Time Interval (1) : The statistics will be re-measured and reported every second
- Count Value (5) : The statistics will be reported five times before it exits.
4) atop
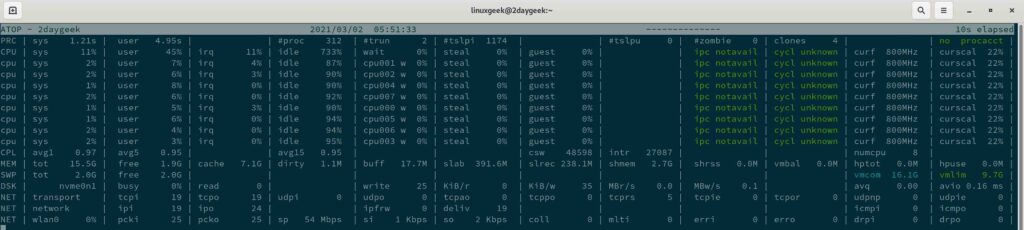
atop command is another performance monitoring tool that is capable of reporting the activity of all processes (even if processes have finished during the interval) on a Linux system.
It reports a statistic per process every 10 seconds, which quickly grasps the changes taking place in the system.
# atop | grep DSK
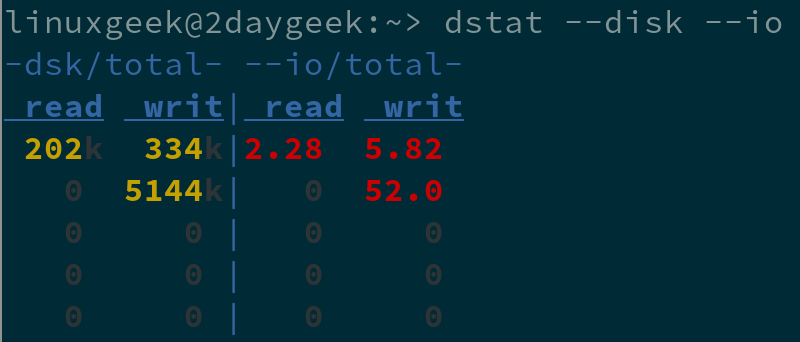
5) dstat
dstat command is another handy tool for monitoring systems during performance tuning tests, benchmarks or troubleshooting. It overcomes some of the limitations of other tools and adds some extra features, more counters and flexibility.
By default, it displays reports at 1 second interval:
# dstat --disk --io
For specific disk, run:
# dstat --disk --io -D sda
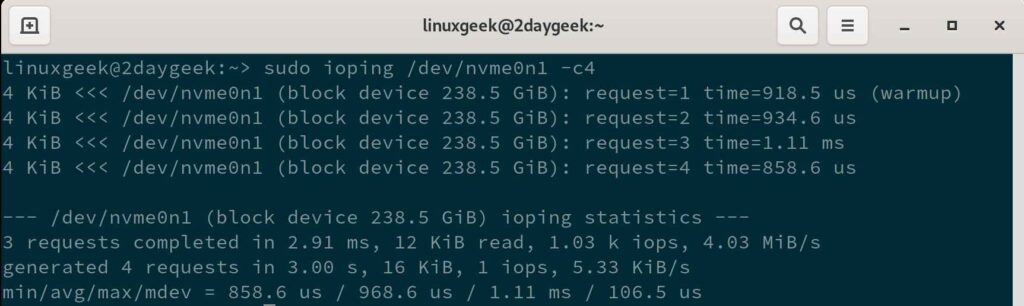
6) ioping
ioping is used to monitor I/O speed and latency in real time, whereas ping command shows network latency. This simple utility makes you understand how long it takes a disk to respond to requests.
# ioping /dev/nvme0n1 -c4
Closing Notes
In this tutorial, you have learned several commands for measuring disk I/O performance in real-time. We have only added a few options, please visit their man page to dig further into this topic.
If you have any questions or feedback, feel free to comment below.

your #2 answer is …. # iotop -dxm
I think you mean iostat ?
@Charles,
Yup, it is update in the article.
Nice. TIL that you can ping your storage devices.
You wouldn’t happen to know of a way to monitor file throughput, like the Windows resource monitor can? Where it shows you a list of files being accessed on storage and the amount of data being written to/read from each file?
@Jason, I hope, you can find this information from the iotop command output.
Hi,
Thank you so much for the great topic.
@Jalal, Welcome