Troubleshooting performance problems on Linux system every day is really a challenging task for a Linux system administrator.
High CPU, memory, and disk I/O usage is one of them, which makes the Linux system to experience performance problems.
Often the CPU or memory performance is one aspect of measuring the performance of a Linux system.
There are many tools in Linux to monitor system performance.
But make sure you use the right tool at the right time to debug the problem.
Top command is one of the best and most widely used commands. It is already pre-installed on most of Linux or Unix systems.
We have included many top command examples in this tutorial for better understanding.
What’s top Command?
The top program provides a dynamic real-time view of a running process on a Linux system.
It displays system summary information and a list of processes currently managed by the Linux kernel.
It displays various system information such as CPU usage, Memory usage, Swap Memory, Number of running processes, system uptime, system load, Buffer Size, Cache Size, Process PID, etc.
By default, it sorts an output with the CPU usage and updates the top command data every 3 seconds.
The top command output has two portions, the first part comes with five rows, each row has different values, the second portion comes with multiple rows, which shows the process information.
You need to properly understand the top command output to fix the performance issue.
1) How to Launch the top Command Without any Options
When you run the top command with no options, you get a output like the one below.
It doesn’t display detailed information about the running process in the command section.
By default, the top command sorts the output with the CPU usage.
I recommend using the -c switch with the top command to see detailed information about the running process in the command section.
$ top

top - 02:15:06 up 1 day, 17:29,  1 user,  load average: 1.61, 1.89, 1.63
Tasks: 312 total,   1 running, 311 sleeping,   0 stopped,   0 zombie
%Cpu(s):  6.8 us,  3.5 sy,  0.0 ni, 88.3 id,  0.0 wa,  0.5 hi,  0.8 si,  0.0 st
KiB Mem : 16248572 total,   841000 free,  8532776 used,  6874796 buff/cache
KiB Swap: 17873388 total, 17451304 free,   422084 used.  4615532 avail Mem

  PID USER      PR  NI    VIRT    RES    SHR S  %CPU  %MEM     TIME+ COMMAND
 6879 daygeek   20     3869648   1.3g   1.2g S   4.0   8.4  56:30.84 VirtualBoxVM
 6821 daygeek   20     3377064   1.1g   1.0g S   3.0   7.0  34:51.59 VirtualBoxVM
 2052 daygeek   20     3698548   1.0g 493232 S  43.7   6.5 187:03.95 Web Content
 4074 daygeek   20     3829264 876352 176000 S   1.7   5.4  43:01.20 Web Content
 1819 daygeek   20     5044548 812932 345636 S  13.6   5.0 135:09.17 firefox
 1890 daygeek   20     3279128 576348 301008 S   1.3   3.5  29:14.29 Web Content
 1254 daygeek   20     4368028 559316 272860 S   0.3   3.4  38:58.41 gnome-shell
 4599 daygeek   20     3182872 463040 105120 S   1.3   2.8  87:09.55 Web Content
 1197 daygeek   20      923572 414640 396104 S   2.0   2.6  55:37.74 Xorg
 8155 daygeek   20     3193040 377884 186492 S   1.3   2.3  16:44.10 Web Content
2) How to Display the Absolute Path of the Running Process in the top Command Output
If you use the -c switch, the top command prints the absolute path of the running process in the command section.
It will give you an idea of what the process is and what is working.
$ top -c

top - 02:13:22 up 1 day, 17:28,  1 user,  load average: 2.20, 1.94, 1.61
Tasks: 312 total,   2 running, 310 sleeping,   0 stopped,   0 zombie
%Cpu(s): 18.6 us,  3.9 sy,  0.0 ni, 76.1 id,  0.0 wa,  0.4 hi,  1.0 si,  0.0 st
KiB Mem : 16248572 total,  1061124 free,  8497000 used,  6690448 buff/cache
KiB Swap: 17873388 total, 17451304 free,   422084 used.  4833088 avail Mem

  PID USER      PR  NI    VIRT    RES    SHR S  %CPU  %MEM     TIME+ COMMAND
 2052 daygeek   20     3516628 869240 316100 R  82.0   5.3 185:55.39 /usr/lib/firefox/firefox -cont+
 1819 daygeek   20     4868052 855524 402384 S  26.2   5.3 134:44.87 /usr/lib/firefox/firefox --new+
 1254 daygeek   20     4368140 559224 272928 S  14.8   3.4  38:48.99 /usr/bin/gnome-shell
 4145 daygeek   20     2815672 258752  82768 S  14.8   1.6  51:35.85 /usr/bin/../lib/notepadqq/note+
 1197 daygeek   20      923212 414832 396296 S   8.2   2.6  55:29.68 /usr/lib/Xorg vt2 -displayfd 3+
20342 daygeek   20       13680   4084   3092 R   6.6   0.0   0:00.21 top
 2175 daygeek   20      408428  29648  21852 S   4.9   0.2  22:45.28 /usr/lib/firefox/firefox -cont+
 6879 daygeek   20     3870712   1.3g   1.2g S   4.9   8.5  56:25.75 /usr/lib/virtualbox/VirtualBox+
 1238 daygeek    9 -11 2866264  25656  20592 S   3.3   0.2  51:16.32 /usr/bin/pulseaudio --daemoniz+
 8155 daygeek   20     3193040 375244 186492 S   3.3   2.3  16:42.84 /usr/lib/firefox/firefox -cont+
   10 root      -2                           I   1.6         1:06.77 [rcu_preempt]
 1890 daygeek   20     3279128 574764 301008 S   1.6   3.5  29:13.19 /usr/lib/firefox/firefox -cont+
 1956 daygeek   20     2520120 153080  55804 S   1.6   0.9   6:43.59 /usr/lib/firefox/firefox -cont+
 4074 daygeek   20     3829264 874572 176000 S   1.6   5.4  42:57.72 /usr/lib/firefox/firefox -cont+
 5665 daygeek   20      489952  44376  26544 S   1.6   0.3   2:35.60 /usr/lib/gnome-terminal-server
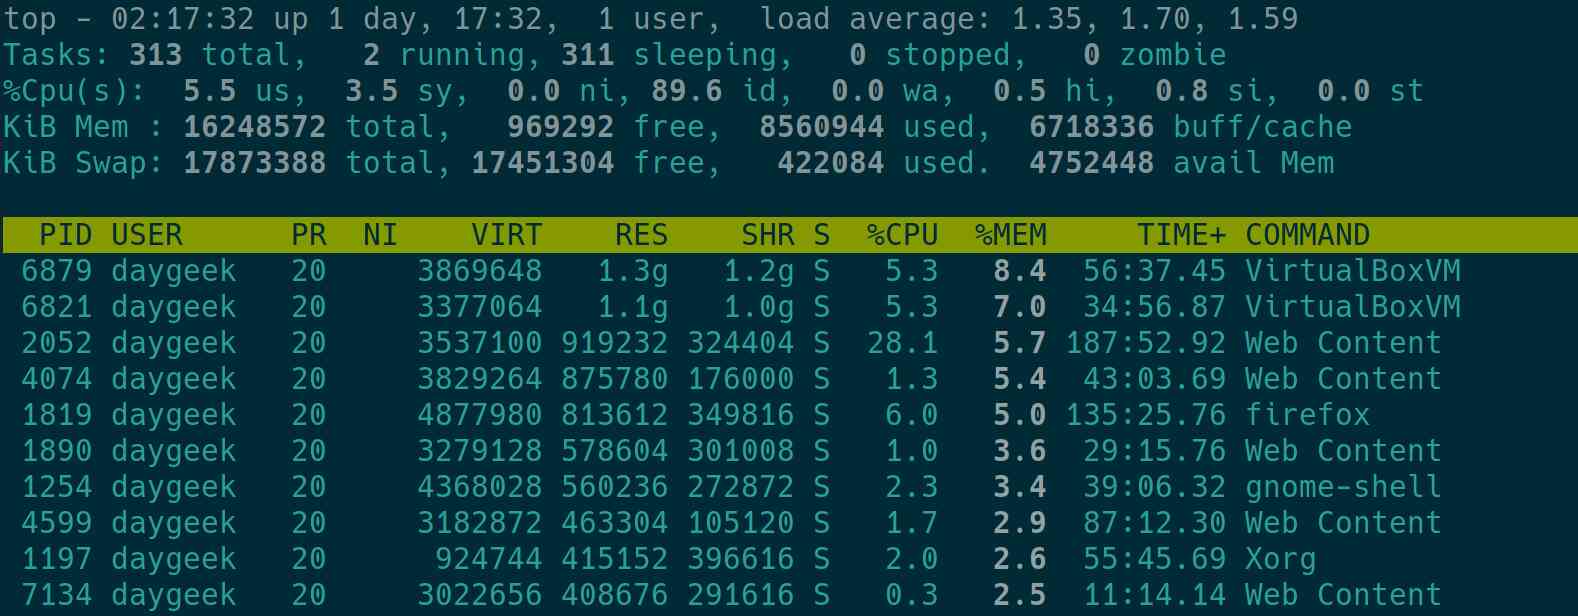
3) How to Sort Processes Based on Memory Usage in the top Command Output
By default, the top command sort the output based on CPU usage. Press Shift+m to sort the top command output through the memory usage.
$ top

top - 02:15:06 up 1 day, 17:29,  1 user,  load average: 1.61, 1.89, 1.63
Tasks: 312 total,   1 running, 311 sleeping,   0 stopped,   0 zombie
%Cpu(s):  6.8 us,  3.5 sy,  0.0 ni, 88.3 id,  0.0 wa,  0.5 hi,  0.8 si,  0.0 st
KiB Mem : 16248572 total,   841000 free,  8532776 used,  6874796 buff/cache
KiB Swap: 17873388 total, 17451304 free,   422084 used.  4615532 avail Mem

  PID USER      PR  NI    VIRT    RES    SHR S  %CPU  %MEM     TIME+ COMMAND
 6879 daygeek   20     3869648   1.3g   1.2g S   4.0   8.4  56:30.84 VirtualBoxVM
 6821 daygeek   20     3377064   1.1g   1.0g S   3.0   7.0  34:51.59 VirtualBoxVM
 2052 daygeek   20     3698548   1.0g 493232 S  43.7   6.5 187:03.95 Web Content
 4074 daygeek   20     3829264 876352 176000 S   1.7   5.4  43:01.20 Web Content
 1819 daygeek   20     5044548 812932 345636 S  13.6   5.0 135:09.17 firefox
 1890 daygeek   20     3279128 576348 301008 S   1.3   3.5  29:14.29 Web Content
 1254 daygeek   20     4368028 559316 272860 S   0.3   3.4  38:58.41 gnome-shell
 4599 daygeek   20     3182872 463040 105120 S   1.3   2.8  87:09.55 Web Content
 1197 daygeek   20      923572 414640 396104 S   2.0   2.6  55:37.74 Xorg
 8155 daygeek   20     3193040 377884 186492 S   1.3   2.3  16:44.10 Web Content
 8114 daygeek   20     3123648 374564  97440 S   0.7   2.3  21:39.48 Web Content
 3892 daygeek   20     2996852 346496  99100 S   0.7   2.1  25:15.14 Web Content
 4145 daygeek   20     2815672 258752  82768 S   7.0   1.6  51:44.05 notepadqq-bin
4) How to Sort Processes Based on CPU Usage in the top Command Output
Press Shift+p to Sort the top command output through the CPU usage.
$ top

top - 02:16:16 up 1 day, 17:30,  1 user,  load average: 1.21, 1.71, 1.58
Tasks: 313 total,   1 running, 312 sleeping,   0 stopped,   0 zombie
%Cpu(s):  8.8 us,  3.4 sy,  0.0 ni, 86.4 id,  0.1 wa,  0.5 hi,  0.8 si,  0.0 st
KiB Mem : 16248572 total,   836480 free,  8533272 used,  6878820 buff/cache
KiB Swap: 17873388 total, 17451304 free,   422084 used.  4616556 avail Mem

  PID USER      PR  NI    VIRT    RES    SHR S  %CPU  %MEM     TIME+ COMMAND
 2052 daygeek   20     3698964   1.0g 491816 S  31.1   6.6 187:29.13 Web Content
 1819 daygeek   20     5042916 826284 362308 S  15.4   5.1 135:17.64 firefox
 1254 daygeek   20     4367964 559748 272800 S  11.4   3.4  39:01.39 gnome-shell
 1197 daygeek   20      923724 414904 396368 S   8.7   2.6  55:41.17 Xorg
 4145 daygeek   20     2815672 258752  82768 S   8.0   1.6  51:49.33 notepadqq-bin
 2175 daygeek   20      408428  29648  21852 S   5.4   0.2  22:54.49 RDD Process
 6821 daygeek   20     3377064   1.1g   1.0g S   4.7   7.0  34:54.15 VirtualBoxVM
 1238 daygeek    9 -11 2866264  25656  20592 S   3.3   0.2  51:22.50 pulseaudio
 6879 daygeek   20     3869648   1.3g   1.2g S   3.3   8.4  56:34.00 VirtualBoxVM
 4599 daygeek   20     3182872 463304 105120 S   2.0   2.9  87:10.85 Web Content
 4074 daygeek   20     3829264 875404 176000 S   1.7   5.4  43:02.45 Web Content
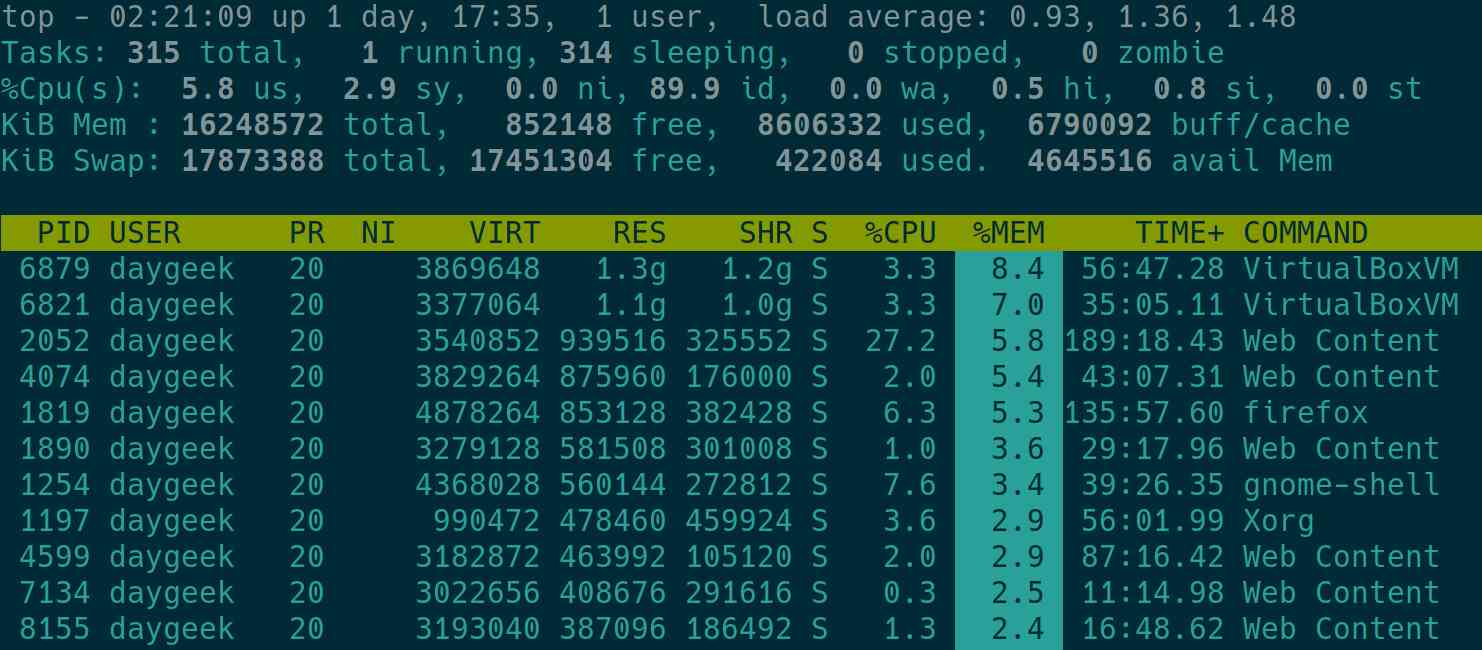
5) How to Bold a Text to a Column Sorted in the top Command Output
When you sort some field, you may feel that it’s not clear. Make bold the column text by pressing the x key on your keyboard.
6) How to Add a Background Color to a Column that is Sorted in the top Command Output
If you feel that the sorted column is not clear after adding bold text to a column. Don’t worry, you have a way to highlight them with the background color.
To do so, press the b key on your keyboard.
7) How to Sort Processes in Reverse Order in the top Command Output
By default the sorting is done in descending order. Press Shift+r to sort the top command output in ascending order.
# top

top - 21:45:32 up 23:00,  2 users,  load average: 0.00, 0.01, 0.05
Tasks: 161 total,   1 running, 160 sleeping,   0 stopped,   0 zombie
%Cpu(s):  0.0 us,  0.0 sy,  0.0 ni, 99.7 id,  0.0 wa,  0.0 hi,  0.3 si,  0.0 st
%Node0 :  0.0 us,  0.0 sy,  0.0 ni, 99.7 id,  0.0 wa,  0.0 hi,  0.3 si,  0.0 st
KiB Mem :  1882300 total,  1093528 free,   384100 used,   404672 buff/cache
KiB Swap:  2097148 total,  2097148 free,        0 used.  1285728 avail Mem

  PID USER      PR  NI    VIRT    RES    SHR S %CPU %MEM     TIME+ COMMAND
    1 root      20   0  128280   6840   4176 S  0.0  0.4   0:04.24 systemd
    2 root      20   0       0      0      0 S  0.0  0.0   0:00.02 kthreadd
    3 root      20   0       0      0      0 S  0.0  0.0   0:01.79 ksoftirqd/0
    5 root       0 -20       0      0      0 S  0.0  0.0   0:00.00 kworker/0:0H
    6 root      20   0       0      0      0 S  0.0  0.0   0:00.16 kworker/u2:0
    7 root      rt   0       0      0      0 S  0.0  0.0   0:00.00 migration/0
    8 root      20   0       0      0      0 S  0.0  0.0   0:00.00 rcu_bh
    9 root      20   0       0      0      0 S  0.0  0.0   0:01.53 rcu_sched
8) How to Filter a Processes in the top Command Output
The process list can be filtered based on a number of criteria such as process name, memory usage, cpu usage.
Press Shift+o or o to activate the filter. If this is enabled, you will see the line like the one below.
To use the filter, you must enter two values: field_name=values.
For example, if you only want to list virtualbox related processes, your filter should be COMMAND=virtualbox.
Similarly you can sort any fields by filtering them with the appropriate value.
$ top

top - 02:34:04 up 1 day, 17:48,  1 user,  load average: 2.52, 1.73, 1.57
Tasks: 318 total,   2 running, 316 sleeping,   0 stopped,   0 zombie
%Cpu(s): 10.6 us,  8.3 sy,  0.0 ni, 80.0 id,  0.1 wa,  0.4 hi,  0.7 si,  0.0 st
KiB Mem : 16248572 total,  1520972 free,  7837960 used,  6889640 buff/cache
KiB Swap: 17873388 total, 17453352 free,   420036 used.  5399068 avail Mem
add filter #2 (case sensitive) as: [!]FLD?VAL
  PID USER      PR  NI    VIRT    RES    SHR S  %CPU  %MEM     TIME+ COMMAND
21251 daygeek   20     2752408 540964 429556 R  98.0   3.3   1:31.75 /usr/lib/virtualbox/VirtualBo+
21194 daygeek   20     3810052   1.1g   1.0g S   2.6   7.0   1:08.62 /usr/lib/virtualbox/VirtualBo+
 6747 daygeek   20     1159928 123312  66364 S   0.7   0.8  10:22.71 /usr/lib/virtualbox/VirtualBox
 6769 daygeek   20       67628   9388   6916 S   0.7   0.1  10:03.23 /usr/lib/virtualbox/VBoxXPCOM+
 6774 daygeek   20     1032360  24692  15300 S   0.7   0.2  20:19.16 /usr/lib/virtualbox/VBoxSVC -+
9) How to Display Only Specific User Processes in the top Command Output
Sometimes a particular user processes can take up more resources on the system, if you want to see their process.
Press Shift+u or u, and then enter the username you want to verify.
$ top

Tasks: 317 total,   2 running, 315 sleeping,   0 stopped,   0 zombie
%Cpu(s):  7.4 us,  4.2 sy,  0.0 ni, 86.7 id,  0.2 wa,  0.6 hi,  0.9 si,  0.0 st
KiB Mem : 16248572 total,   686364 free,  8469248 used,  7092960 buff/cache
KiB Swap: 17873388 total, 17453608 free,   419780 used.  4583220 avail Mem

  PID USER      PR  NI    VIRT    RES    SHR S  %CPU  %MEM     TIME+ COMMAND
    1 root      20      182756   8860   6344 S   0.3   0.1   2:15.97 systemd
    9 root      20                           S   0.3         0:15.00 ksoftirqd/0
19375 root      20                           I   0.3         0:00.74 kworker/u16:1-events_unbound
21267 root      20                           I   0.3         0:00.18 kworker/u16:2-events_unbound
Alternatively, you can start the top command directly with a specific username, which will show the given user process in the top command output.
# top -u root
10) How to Toggle/Hide an idle Processes in the top Command Output
By default the top command displays all processes, including running and idle/sleeping processes.
The idle processes refers “S” & “I” in the status field and “R” indicates the running processes.
Press i to hide them in the top command output.
$ top

top - 02:40:24 up 1 day, 17:55,  1 user,  load average: 1.27, 1.36, 1.46
Tasks: 316 total,   1 running, 315 sleeping,   0 stopped,   0 zombie
%Cpu(s):  5.4 us,  3.0 sy,  0.0 ni, 90.3 id,  0.0 wa,  0.5 hi,  0.8 si,  0.0 st
KiB Mem : 16248572 total,   719108 free,  8444044 used,  7085420 buff/cache
KiB Swap: 17873388 total, 17453608 free,   419780 used.  4618364 avail Mem

  PID USER      PR  NI    VIRT    RES    SHR S  %CPU  %MEM     TIME+ COMMAND
 2052 daygeek   20     3693532   1.0g 490800 S  28.5   6.5 195:13.08 Web Content
 4145 daygeek   20     2815672 253932  82768 S   7.6   1.6  53:33.16 notepadqq-bin
 1819 daygeek   20     5054336 913276 413012 S   6.3   5.6 137:45.50 firefox
 2175 daygeek   20      408428  29632  21852 S   5.6   0.2  24:07.64 RDD Process
21251 daygeek   20     3268548 936356 854712 S   5.0   5.8   3:17.75 VirtualBoxVM
 1238 daygeek    9 -11 2866264  25204  20140 S   3.3   0.2  52:10.04 pulseaudio
21194 daygeek   20     3840036   1.3g   1.2g S   3.3   8.4   1:38.83 VirtualBoxVM
 1197 daygeek   20      944680 493064 471312 S   2.6   3.0  57:12.03 Xorg
11) How to Hide/Toggle Header Information in the top Command Output
As i said in the beginning of the article, top command output comes with two portions, it’s header and body.
If you want to hide the header portion, use the following keys.
- l: To hide the load average information.
- t: To hide the task and cpu information.
- m: To hide the memory information.
$ top

  PID USER      PR  NI    VIRT    RES    SHR S  %CPU  %MEM     TIME+ COMMAND
 2052 daygeek   20     3704996   1.0g 498680 S  26.4   6.6 195:25.13 Web Content
 1254 daygeek   20     4368140 559388 272940 S  11.3   3.4  40:33.92 gnome-shell
 2175 daygeek   20      408428  29632  21852 S   7.5   0.2  24:09.72 RDD Process
 4145 daygeek   20     2815672 253932  82768 S   7.5   1.6  53:35.95 notepadqq-bin
21194 daygeek   20     3840036   1.3g   1.2g S   7.5   8.4   1:40.04 VirtualBoxVM
 1819 daygeek   20     5064776 952964 446808 S   5.7   5.9 137:50.06 firefox
 1238 daygeek    9 -11 2866264  25204  20140 S   3.8   0.2  52:11.26 pulseaudio
 4599 daygeek   20     3182872 427080 105120 S   3.8   2.6  87:41.61 Web Content
21251 daygeek   20     3302440 953512 854712 S   3.8   5.9   3:20.01 VirtualBoxVM
21643 daygeek   20       13436   3832   3136 R   3.8   0.0   0:00.26 top
12) How to Display All CPU Cores in the top Command Output
By default the header area displays consolidated CPU output, press 1 to display all CPU cores in the top command output.
$ top

top - 02:41:30 up 1 day, 17:56,  1 user,  load average: 1.48, 1.43, 1.48
Tasks: 318 total,   1 running, 317 sleeping,   0 stopped,   0 zombie
%Cpu0  :  7.9 us,  3.4 sy,  0.0 ni, 86.7 id,  0.0 wa,  1.0 hi,  1.0 si,  0.0 st
%Cpu1  :  7.5 us,  3.0 sy,  0.0 ni, 88.0 id,  0.0 wa,  0.5 hi,  1.0 si,  0.0 st
%Cpu2  :  4.5 us,  3.5 sy,  0.0 ni, 90.0 id,  0.0 wa,  1.0 hi,  1.0 si,  0.0 st
%Cpu3  :  6.4 us,  4.4 sy,  0.0 ni, 88.2 id,  0.0 wa,  0.5 hi,  0.5 si,  0.0 st
%Cpu4  :  4.0 us,  4.0 sy,  0.0 ni, 91.0 id,  0.0 wa,  0.5 hi,  0.5 si,  0.0 st
%Cpu5  :  3.5 us,  2.0 sy,  0.0 ni, 93.0 id,  0.0 wa,  0.5 hi,  1.0 si,  0.0 st
%Cpu6  :  9.0 us,  2.5 sy,  0.0 ni, 87.5 id,  0.0 wa,  0.5 hi,  0.5 si,  0.0 st
%Cpu7  :  5.5 us,  3.0 sy,  0.0 ni, 91.0 id,  0.0 wa,  0.0 hi,  0.5 si,  0.0 st
KiB Mem : 16248572 total,   662216 free,  8487460 used,  7098896 buff/cache
KiB Swap: 17873388 total, 17453608 free,   419780 used.  4563824 avail Mem

  PID USER      PR  NI    VIRT    RES    SHR S  %CPU  %MEM     TIME+ COMMAND
 2052 daygeek   20     3701924   1.0g 499220 S  30.7   6.6 195:36.29 Web Content
 4145 daygeek   20     2815672 253932  82768 S   7.4   1.6  53:38.00 notepadqq-bin
 1819 daygeek   20     5064776 968464 463640 S   6.9   6.0 137:53.21 firefox
 2175 daygeek   20      408428  29632  21852 S   5.4   0.2  24:11.22 RDD Process
21251 daygeek   20     3302440 953512 854712 S   5.4   5.9   3:21.53 VirtualBoxVM
 1238 daygeek    9 -11 2866264  25204  20140 S   3.0   0.2  52:12.16 pulseaudio
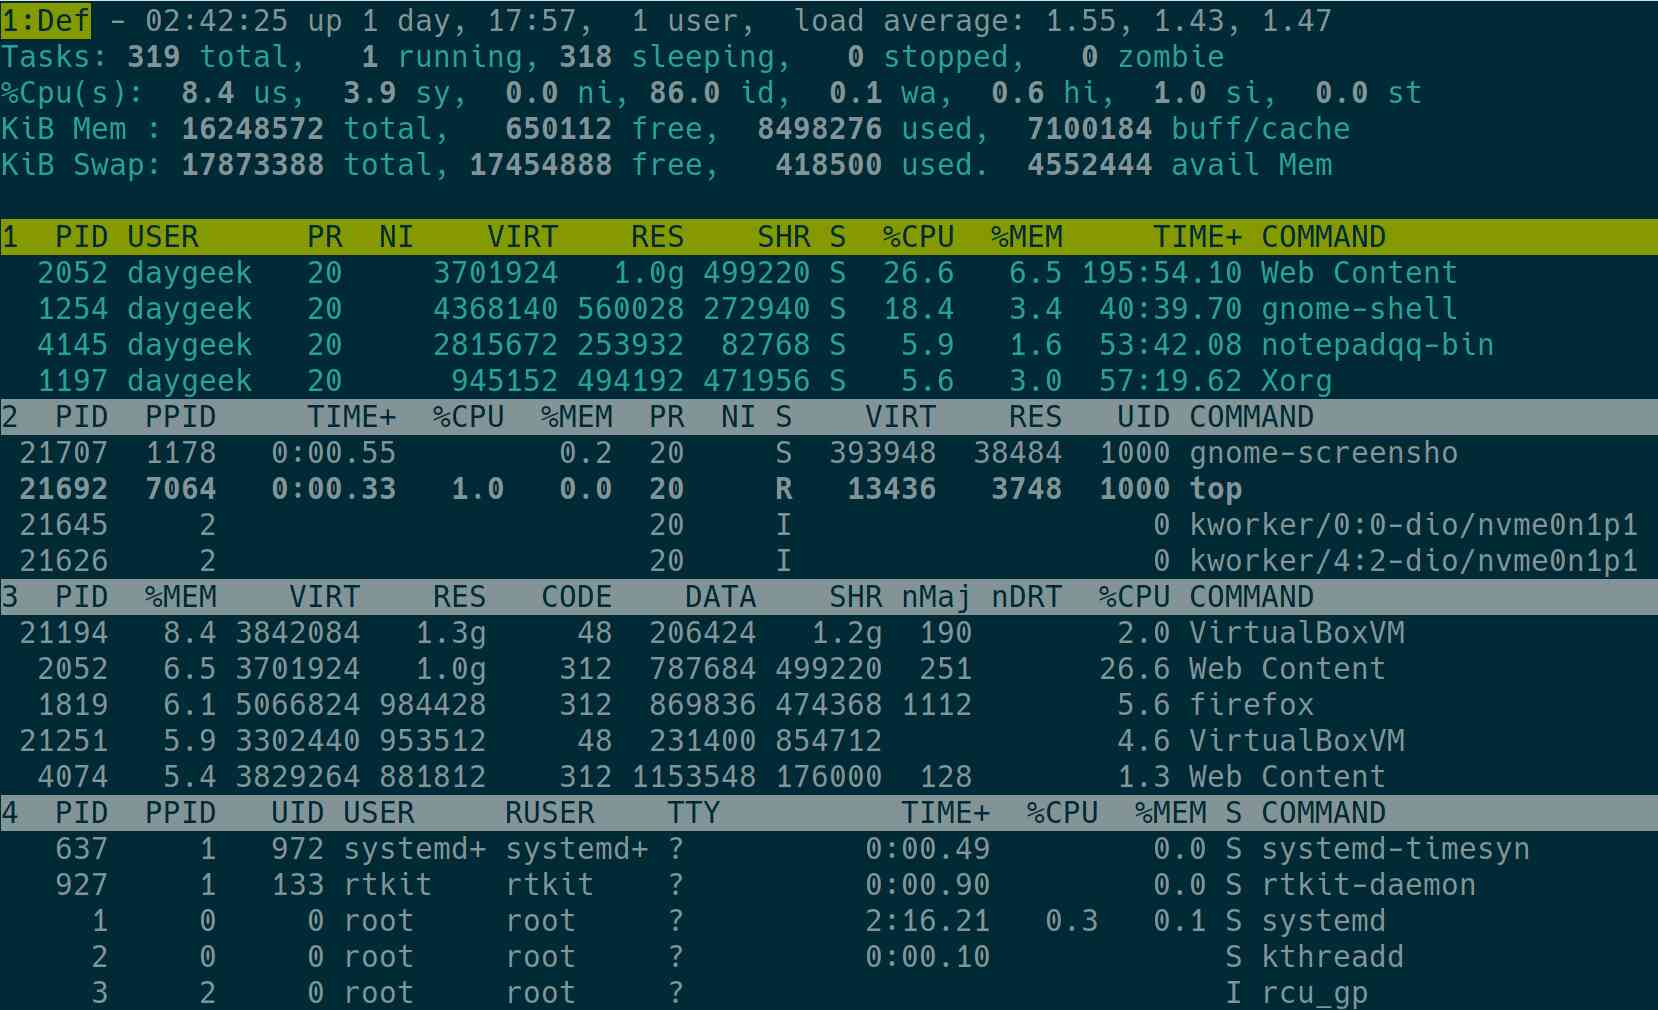
13) How to Split the top Command Output into Multiple Panels
By default the top command output comes with a single panel, press A to display the top command output with multiple panels.
Each panel is sorted with different columns and comes with different fields. Press a to go through the panels.
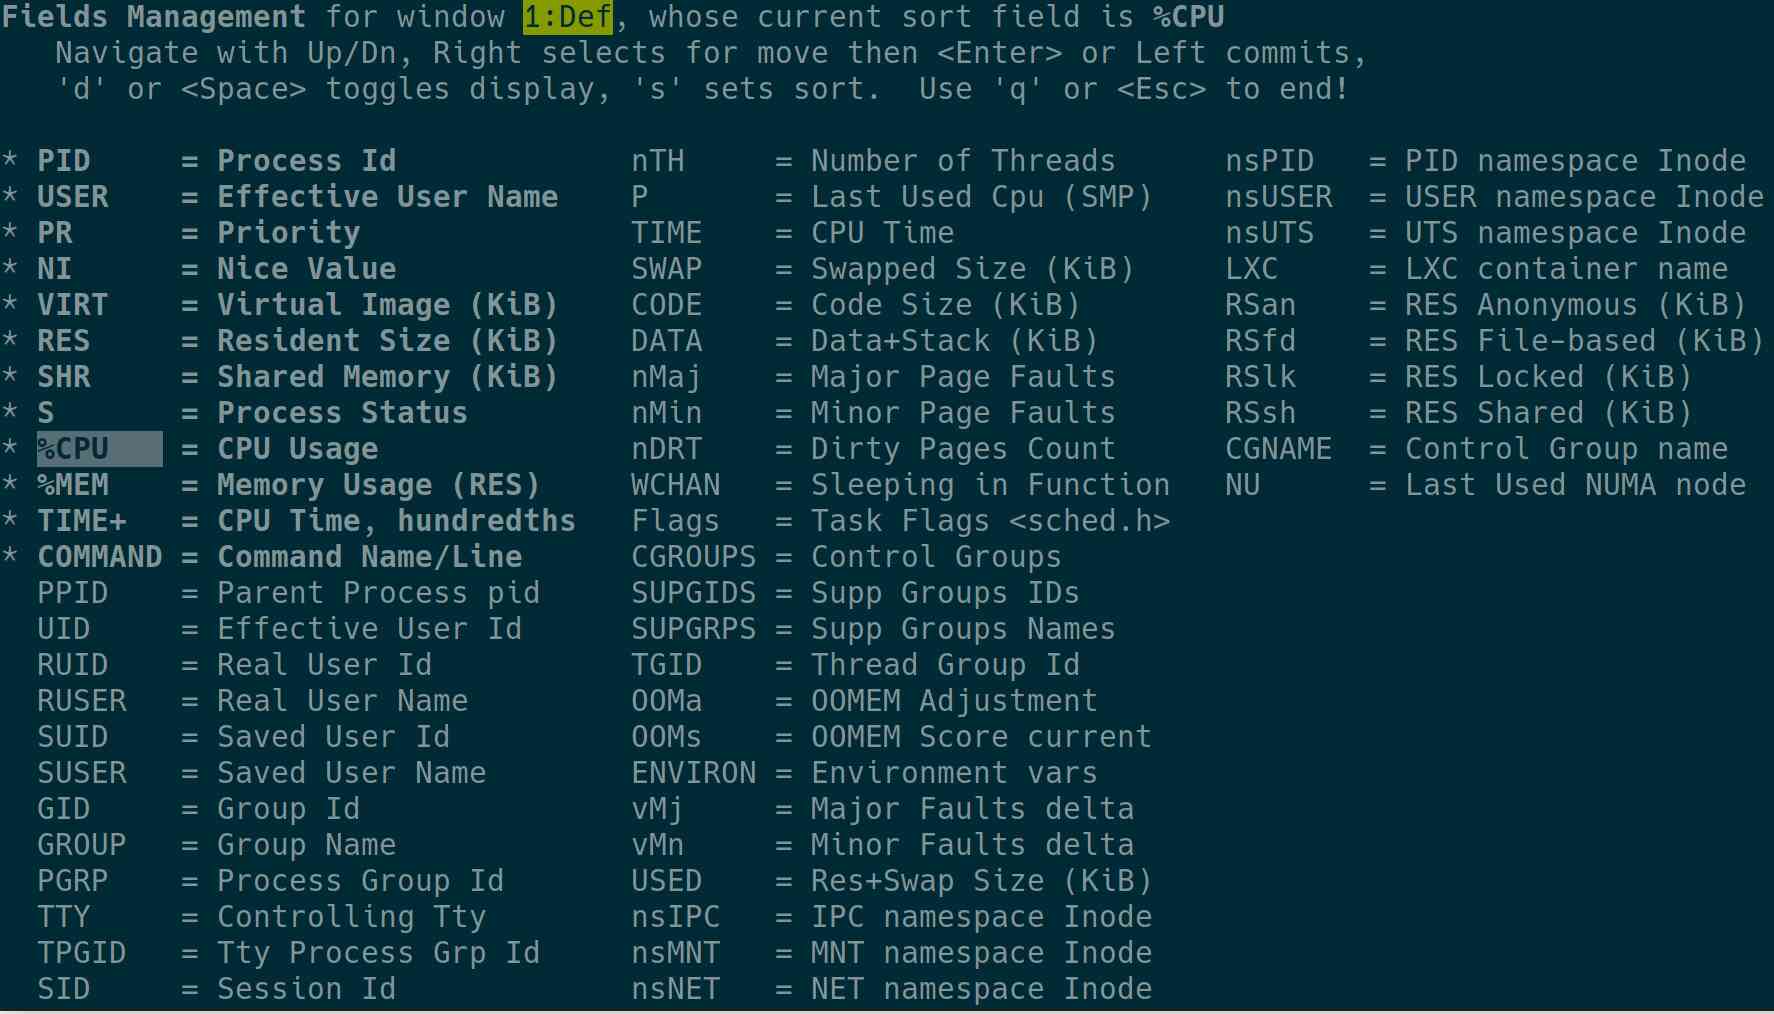
14) How to Enable and Disable a Field Column in the top Command Output
By default, the top command output will display some columns. In the top command output, press f to add, remove, or modify the fields column.
Fields marked as * with bold are now displayed in the top command output.
Navigate to the list using the up/down arrow keys and press d or Space to change the view of that field. When finished, press q to go to the top command output.
I have disabled everything except the fields below.
$ top

top - 02:46:22 up 1 day, 18:01,  1 user,  load average: 1.20, 1.47, 1.49
Tasks: 320 total,   1 running, 319 sleeping,   0 stopped,   0 zombie
%Cpu(s):  6.6 us,  3.8 sy,  0.0 ni, 87.9 id,  0.1 wa,  0.6 hi,  1.0 si,  0.0 st
KiB Mem : 16248572 total,   808964 free,  8417536 used,  7022072 buff/cache
KiB Swap: 17873388 total, 17454888 free,   418500 used.  4724664 avail Mem

  PID USER      %CPU  %MEM     TIME+ COMMAND
 2052 daygeek   28.7   5.6 197:14.68 /usr/lib/firefox/firefox -contentproc -childID 3 -isForBrowse+
 1197 daygeek    7.9   3.0  57:32.73 /usr/lib/Xorg vt2 -displayfd 3 -auth /run/user/1000/gdm/Xauth+
 1254 daygeek    7.9   3.4  41:00.82 /usr/bin/gnome-shell
 4145 daygeek    7.6   1.6  53:59.87 /usr/bin/../lib/notepadqq/notepadqq-bin
 1819 daygeek    5.9   4.9 138:24.90 /usr/lib/firefox/firefox --new-window
 2175 daygeek    5.6   0.2  24:28.04 /usr/lib/firefox/firefox -contentproc -parentBuildID 20191031+
 5665 daygeek    5.0   0.3   3:10.49 /usr/lib/gnome-terminal-server
21251 daygeek    4.6   5.9   3:36.55 /usr/lib/virtualbox/VirtualBoxVM --comment CentOS7 --startvm +
 1238 daygeek    3.3   0.2  52:21.45 /usr/bin/pulseaudio --daemonize=no
15) How to Kill the Running Process in the top Command Output
If some process uses too much usage on the server, you may want to kill them to maintain system stability. To do so, press k, which will prompt you to enter the Process ID (PID) to kill it.
Once you kill the particular process, it will go immediately and you will no longer find them in the process list.
$ top

top - 02:48:00 up 1 day, 18:02,  1 user,  load average: 1.00, 1.33, 1.44
Tasks: 320 total,   1 running, 319 sleeping,   0 stopped,   0 zombie
%Cpu(s):  6.8 us,  4.8 sy,  0.0 ni, 86.5 id,  0.0 wa,  0.8 hi,  1.2 si,  0.0 st
KiB Mem : 16248572 total,   759776 free,  8432904 used,  7055892 buff/cache
KiB Swap: 17873388 total, 17454888 free,   418500 used.  4676192 avail Mem
PID to signal/kill [default pid = 2052]
  PID USER      PR  NI    VIRT    RES    SHR S  %CPU  %MEM     TIME+ COMMAND
 2052 daygeek   20     3574836 945228 372088 S  29.0   5.8 197:49.43 Web Content
 1819 daygeek   20     5011336 833872 315620 S   9.7   5.1 138:36.43 firefox
 4145 daygeek   20     2815672 253924  82768 S   9.7   1.6  54:07.19 notepadqq-bin
21251 daygeek   20     3310632 953512 854712 S   9.7   5.9   3:41.58 VirtualBoxVM
 1197 daygeek   20      943996 493096 470840 S   3.2   3.0  57:38.16 Xorg
 1238 daygeek    9 -11 2866264  25596  20532 S   3.2   0.2  52:24.61 pulseaudio
 1254 daygeek   20     4368172 559480 272972 S   3.2   3.4  41:04.37 gnome-shell
16) How to Display a Processes in a Parent Child Hierarchy (Forest Mode) in the top Command Output
Press Shift+v to display a processes in a parent child hierarchy.
$ top

top - 02:48:00 up 1 day, 18:02,  1 user,  load average: 1.00, 1.33, 1.44
Tasks: 318 total,   1 running, 317 sleeping,   0 stopped,   0 zombie
%Cpu(s): 14.9 us,  5.7 sy,  0.0 ni, 77.7 id,  0.3 wa,  0.5 hi,  0.8 si,  0.0 st
KiB Mem : 16248572 total,   714448 free,  8470100 used,  7064024 buff/cache
KiB Swap: 17873388 total, 17454888 free,   418500 used.  4631868 avail Mem

  PID USER      PR  NI    VIRT    RES    SHR S  %CPU  %MEM     TIME+ COMMAND
    1 root      20      182756   8860   6344 S   0.3   0.1   2:16.83 systemd
  657 polkitd   20     1934140  15152  12220 S   0.3   0.1   0:19.23  `- polkitd
  659 dbus      20       13156   5336   3424 S   0.7   0.0   1:07.57  `- dbus-daemon
  869 gdm       20      188092  21648  11832 S   0.3   0.1   0:07.12              `- Xorg
 1197 daygeek   20      944156 493616 471360 S   4.0   3.0  57:41.70              `- Xorg
 1238 daygeek    9 -11 2866264  25596  20532 S   2.6   0.2  52:26.24      `- pulseaudio
 1254 daygeek   20     4368172 559612 272972 S   3.3   3.4  41:07.33      `- gnome-shell
 4145 daygeek   20     2815672 253924  82768 S   7.3   1.6  54:10.94          `- notepadqq-bin
 6747 daygeek   20     1159928 123312  66364 S   0.7   0.8  10:29.38          `- VirtualBox
11472 daygeek   20     1871300 334712  60108 S   0.3   2.1   1:11.29          `- inkscape
 1819 daygeek   20     5014260 855776 332472 S  34.0   5.3 138:43.28      `- firefox
 1890 daygeek   20     3279128 603732 301008 S   1.0   3.7  29:33.60          `- Web Content
 1956 daygeek   20     2522168 160224  55816 S   1.3   1.0   6:53.44          `- WebExtensions
17) How to Change the Refresh Interval in the top Command Output
By default the top command updates the data every 3 seconds. Press d and enter the interval value you want to change to refresh interval.
$ top

top - 02:50:10 up 1 day, 18:04,  1 user,  load average: 2.47, 1.76, 1.58
Tasks: 316 total,   1 running, 315 sleeping,   0 stopped,   0 zombie
%Cpu(s):  7.8 us,  3.6 sy,  0.0 ni, 87.1 id,  0.1 wa,  0.5 hi,  0.8 si,  0.0 st
KiB Mem : 16248572 total,   931152 free,  8483784 used,  6833636 buff/cache
KiB Swap: 17873388 total, 17453096 free,   420292 used.  4663116 avail Mem
Change delay from 3.0 to
  PID USER      PR  NI    VIRT    RES    SHR S  %CPU  %MEM     TIME+ COMMAND
 2052 daygeek   20     3579920 926968 344340 S  42.1   5.7 198:57.92 Web Content
 1819 daygeek   20     5016588 806276 273672 S   9.3   5.0 139:02.89 firefox
 4145 daygeek   20     2815672 253924  82768 S   7.3   1.6  54:17.17 notepadqq-bin
 2175 daygeek   20      408424  29916  21848 S   4.8   0.2  24:40.67 RDD Process
21251 daygeek   20     3314728 953512 854712 S   4.8   5.9   3:49.25 VirtualBoxVM
 1238 daygeek    9 -11 2866264  25596  20532 S   3.4   0.2  52:28.90 pulseaudio
 1197 daygeek   20      944376 493348 471092 S   3.1   3.0  57:49.78 Xorg
 4599 daygeek   20     3182840 433656 104968 S   2.3   2.7  87:55.34 Web Content
21194 daygeek   20     3845116   1.3g   1.2g S   2.2   8.4   1:59.01 VirtualBoxVM
18) How to Save the Top Command Output in a Text File
The output can’t be saved directly when executing the top command. To do so, you need to run the top command in a batch mode.
The “Batch Mode” option allows you to send top command output to other programs or to a file.
In this mode, top will not accept input and runs until the iterations limit you’ve set with the “-n” command-line option.
# top -bc | head -15 > top-report.txt

# cat top-report.txt
top - 02:51:43 up 1 day, 18:06,  1 user,  load average: 1.04, 1.49, 1.50
Tasks: 315 total,   1 running, 314 sleeping,   0 stopped,   0 zombie
%Cpu(s):  5.3 us,  3.0 sy,  0.0 ni, 90.3 id,  0.1 wa,  0.5 hi,  0.8 si,  0.0 st
MiB Mem :  15867.7 total,    788.6 free,   8254.4 used,   6824.7 buff/cache
MiB Swap:  17454.5 total,  17044.0 free,    410.4 used.   4435.0 avail Mem

  PID USER      PR  NI    VIRT    RES    SHR S  %CPU  %MEM     TIME+ COMMAND
 2052 daygeek   20     3615.1m   1.0g 487.4m S  26.4   6.5 199:33.97 Web Content
 4145 daygeek   20     2749.7m 248.0m  80.8m S   7.6   1.6  54:24.07 notepadqq-bin
 1819 daygeek   20     5018.1m 959.3m 442.6m S   5.9   6.0 139:18.78 firefox
 2175 daygeek   20      398.9m  29.2m  21.3m S   5.0   0.2  24:45.15 RDD Process
21251 daygeek   20     3237.0m 931.2m 834.7m S   4.6   5.9   3:54.30 VirtualBoxVM
21194 daygeek   20     3755.0m   1.3g   1.2g S   3.6   8.4   2:01.97 VirtualBoxVM
 1238 daygeek    9 -11 2799.1m  25.0m  20.1m S   3.3   0.2  52:31.96 pulseaudio
 1197 daygeek   20      920.4m 480.9m 459.2m S   2.3   3.0  57:57.69 Xorg
 4599 daygeek   20     3108.2m 419.4m 102.5m S   2.3   2.6  87:57.40 Web Content
 4074 daygeek   20     3727.5m 764.8m 171.7m S   1.7   4.8  43:44.04 Web Content
 6774 daygeek   20     1008.2m  24.1m  14.9m S   1.7   0.2  20:35.75 VBoxSVC
19) How to Change the Memory Format from KB to MB,GB and TB
By default the top command displays the memory output in KBs, which makes it difficult to identify memory usage immediately when you have large memory sizes.
To do this accurately, press Shift+e to change the memory format from KB to MB, GB and TB in the header area. Press e to change the format of the memory for VIRT, RSS and SHR in the body fields.
$ top

top - 02:51:43 up 1 day, 18:06,  1 user,  load average: 1.04, 1.49, 1.50
Tasks: 315 total,   1 running, 314 sleeping,   0 stopped,   0 zombie
%Cpu(s):  5.3 us,  3.0 sy,  0.0 ni, 90.3 id,  0.1 wa,  0.5 hi,  0.8 si,  0.0 st
MiB Mem :  15867.7 total,    788.6 free,   8254.4 used,   6824.7 buff/cache
MiB Swap:  17454.5 total,  17044.0 free,    410.4 used.   4435.0 avail Mem

  PID USER      PR  NI    VIRT    RES    SHR S  %CPU  %MEM     TIME+ COMMAND
 2052 daygeek   20     3615.1m   1.0g 487.4m S  26.4   6.5 199:33.97 Web Content
 4145 daygeek   20     2749.7m 248.0m  80.8m S   7.6   1.6  54:24.07 notepadqq-bin
 1819 daygeek   20     5018.1m 959.3m 442.6m S   5.9   6.0 139:18.78 firefox
 2175 daygeek   20      398.9m  29.2m  21.3m S   5.0   0.2  24:45.15 RDD Process
21251 daygeek   20     3237.0m 931.2m 834.7m S   4.6   5.9   3:54.30 VirtualBoxVM
21194 daygeek   20     3755.0m   1.3g   1.2g S   3.6   8.4   2:01.97 VirtualBoxVM
 1238 daygeek    9 -11 2799.1m  25.0m  20.1m S   3.3   0.2  52:31.96 pulseaudio
 1197 daygeek   20      920.4m 480.9m 459.2m S   2.3   3.0  57:57.69 Xorg
 4599 daygeek   20     3108.2m 419.4m 102.5m S   2.3   2.6  87:57.40 Web Content
20) How to Sort Output Based on Specific Fields
In the latest version of the top command release, press the “f” key to sort the fields via the field letter.
To sort with a new field, use the “up/down” arrow to select the correct selection, and then press “s” to sort it. Finally press “q” to exit from this window.
For older version of the top command, press the “shift+f” or “shift+o” key to sort the fields via the field letter.
To sort with a new field, select the corresponding sort field letter, and then press “Enter” to sort it.
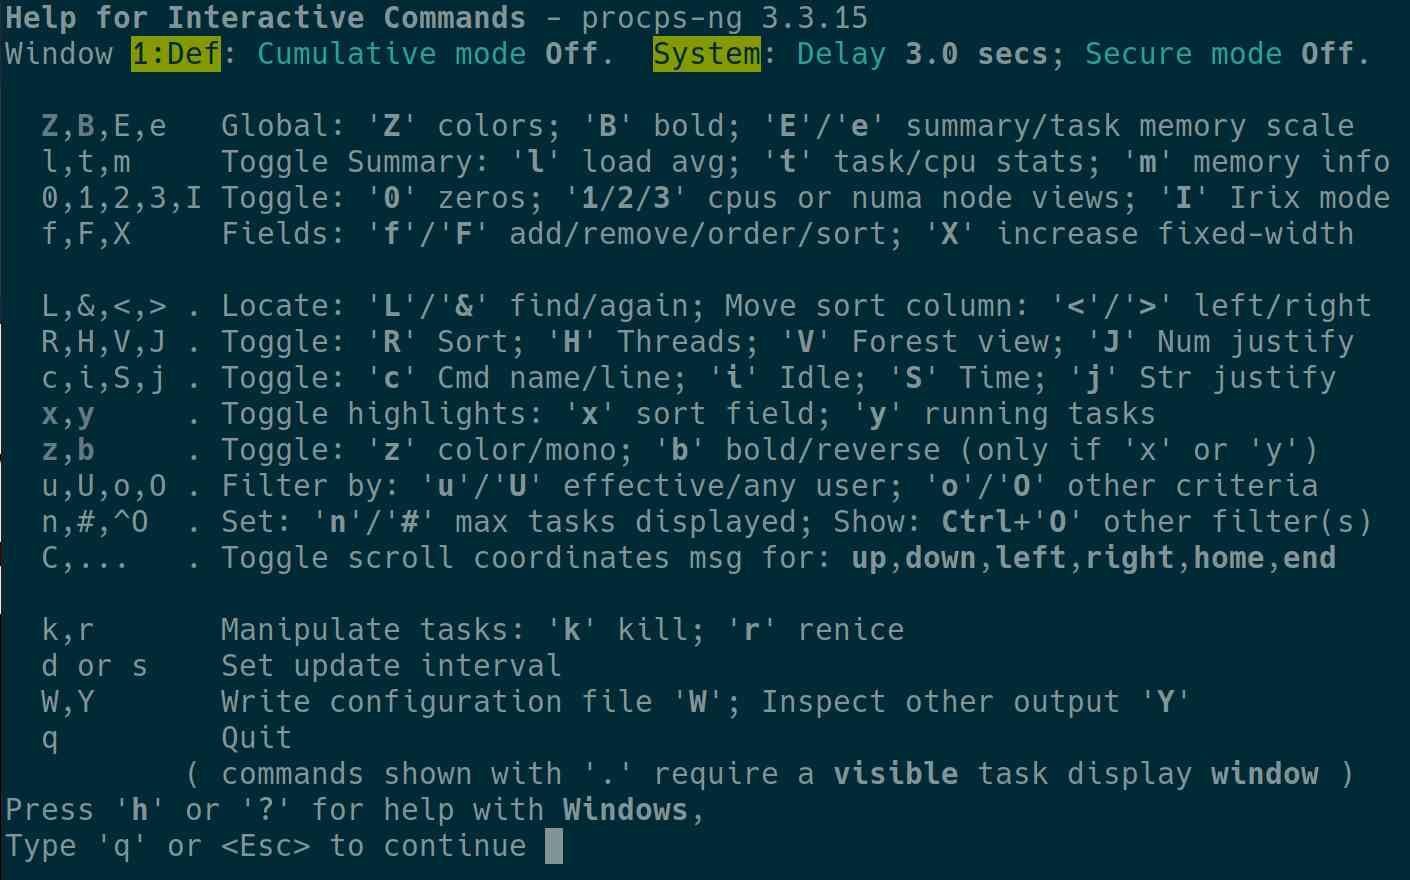
Press “h” to get an instant help from the top command.