top command is one of the frequently used command by many of the Linux administrator to understand and view the resource utilization by processes on the server.
It could be used multiple times in a day. I use many times in a day as my infra is too big.
This output helps us to identify which process is consuming high memory or CPU in system.
Also we can check how long a process being running in system.
In this tutorial, we will teach you, how to understand the top command output so, that you can easily troubleshoot when you are facing any performance issue in system.
When you execute the top command on Linux system, it shows a lot of results and we can split it to two parts. It’s Part-A and Part-A.
Part-A comes with five rows and all are necessary, Part-B comes with many lines, in that we are going to take only first two lines because rests are same
Part-A rows values are as follow like top, Tasks, Cpu(s), Mem and Swap.
Part-A rows values are as follow like PID, USER, PR, NI, VIRT, RES, SHR, S, %CPU, %MEM, TIME+ and COMMAND.
I will show you this in details.
How to Read Linux Top Command Output?
When you execute the top command on Linux system, you will be getting an similar output like below. It may slightly vary if you use latest version of the top command.
# top -c

top - 08:44:56 up 162 days, 16:07,  4 users,  load average: 1.00, 1.05, 0.93
Tasks: 263 total,   1 running, 262 sleeping,   0 stopped,   0 zombie
Cpu(s):  7.4%us,  0.8%sy,  0.0%ni, 91.7%id,  0.0%wa,  0.0%hi,  0.0%si,  0.0%st
Mem:  32949868k total, 13928996k used, 19020872k free,  1323780k buffers
Swap:  6144852k total,        0k used,  6144852k free, 10745792k cached

  PID USER      PR  NI  VIRT  RES  SHR S %CPU %MEM    TIME+  COMMAND
24963 mysql     15   0 1127m 645m 5444 S 51.8  2.0  11787:24 /usr/sbin/mysqld --basedir=/ --datadir=/var/lib/mysql --user=mysql --log-error=/var/lib/mysql/server.anant
 6172 root      15   0  539m 268m 6972 S  0.0  0.8   6:51.71 /usr/sbin/clamd
 5710 root      15   0 1416m  72m  12m S  0.0  0.2 854:24.34 ./jre/bin/java -Djava.compiler=NONE -cp /usr/StorMan/RaidMan.jar com.ibm.sysmgt.raidmgr.agent.ManagementAg
 6226 root      15   0  161m  51m 2932 S  0.0  0.2   0:01.91 /usr/local/cpanel/3rdparty/perl/514/bin/spamd -d --allowed-ips=127.0.0.1 --pidfile=/var/run/spamd.pid --ma
 6282 root      18   0  161m  49m 1200 S  0.0  0.2   0:00.00 spamd child
 6283 root      18   0  161m  49m 1200 S  0.0  0.2   0:00.01 spamd child
 5787 root      34  19  275m  40m 2128 S  0.0  0.1   3:04.23 /usr/bin/python -tt /usr/sbin/yum-updatesd
 3184 root      10 -10 38936  32m 1740 S  0.0  0.1   0:00.00 iscsiuio
 5378 root      15   0 94604  17m 5268 S  0.0  0.1   7:42.59 cpsrvd (SSL) - waiting for c --llu=1383769956 --listen=3,4,5,6,7,8,9,10
 6839 root      18   0  106m  15m  616 S  0.0  0.0   0:00.00 cpdavd - accepting connections on 2077 and 2078
30217 jobtarin  16   0  176m  15m 8412 S  1.7  0.0   0:00.05 /usr/bin/php /home/jobtarin/public_html/new/job-search-keyword-it.php
27317 cpanelro  15   0 94816  15m 2752 S  0.0  0.0   0:00.11 webmaild - serving 219.91.21 --llu=1383769956 --listen=3,4,5,6,7,8,9,10
30216 jobtarin  17   0  175m  15m 8396 S  1.7  0.0   0:00.05 /usr/bin/php /home/jobtarin/public_
  961 nobody    15   0 92648  10m 3392 S  0.0  0.0   0:01.40 /usr/local/apache/bin/httpd -k start -DSSL
 6790 root      15   0 48644  10m 1640 S  0.0  0.0   3:21.47 tailwatchd
12171 root      18   0 91492  10m 4132 S  0.0  0.0   2:13.48 /usr/local/apache/bin/httpd -k start -DSSL
  934 nobody    15   0 92232  10m 3368 S  0.0  0.0   0:01.28 /usr/local/apache/bin/httpd -k start -DSSL
 1151 nobody    15   0 92228  10m 3360 S  0.0  0.0   0:01.08 /usr/local/apache/bin/httpd -k start -DSSL
As described above, we have split it up with two parts.

Output of Row-1
Row-1 output shows the system uptime from the last reboot, currently logged in users and CPU load for last 5/10/15 mins on the system.
The same results can be viewed by Linux uptime Command. Also, you can use /proc/loadavg file as well.
top:08:44:56 up 162 days, 16:07, 4 users, load average: 1.00, 1.05, 0.93
Output of Row-2
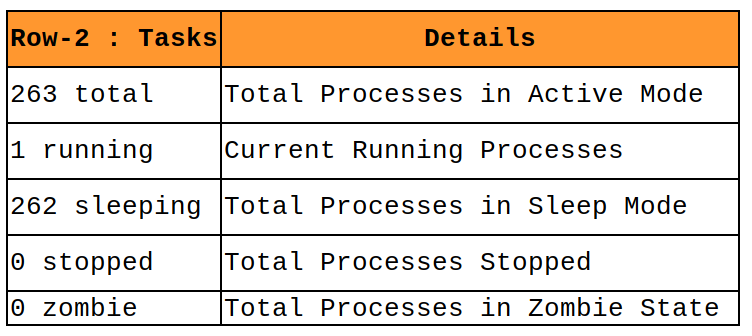
Row-2 output shows the number of process currently running on the system and their state.
Zombie process or defunct process is a child’s process that has completed execution but they might exist due to dead of parent processes.
Say for example, every Linux process has a parent process, which is used to kill respective child process once the child process completes their work. Also, the parent process kill itself.
If the parent process is not exist then the child process is became a Zombie process or defunct process.
Tasks: 263 total, 1 running, 262 sleeping, 0 stopped, 0 zombie
Output of Row-3
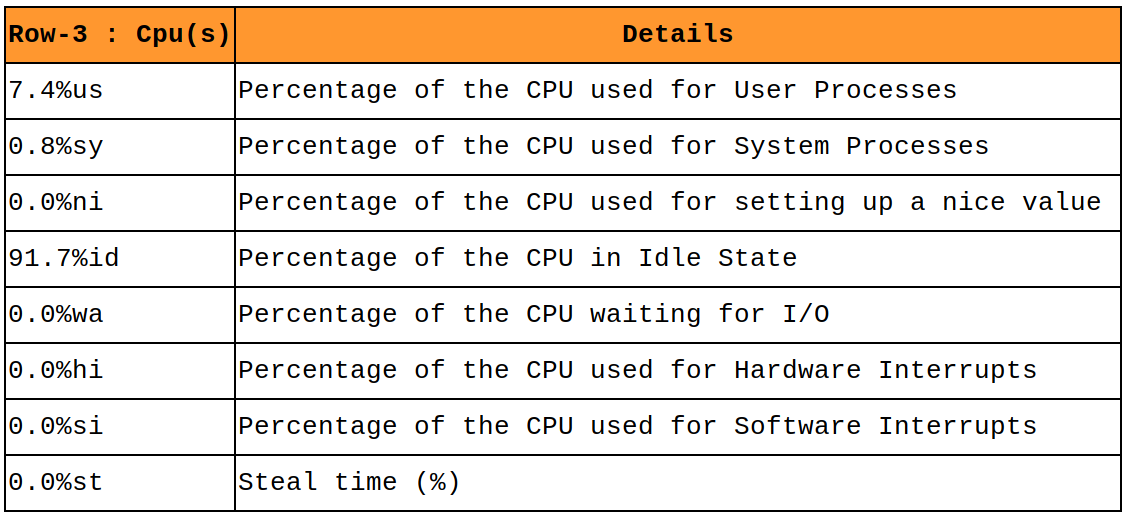
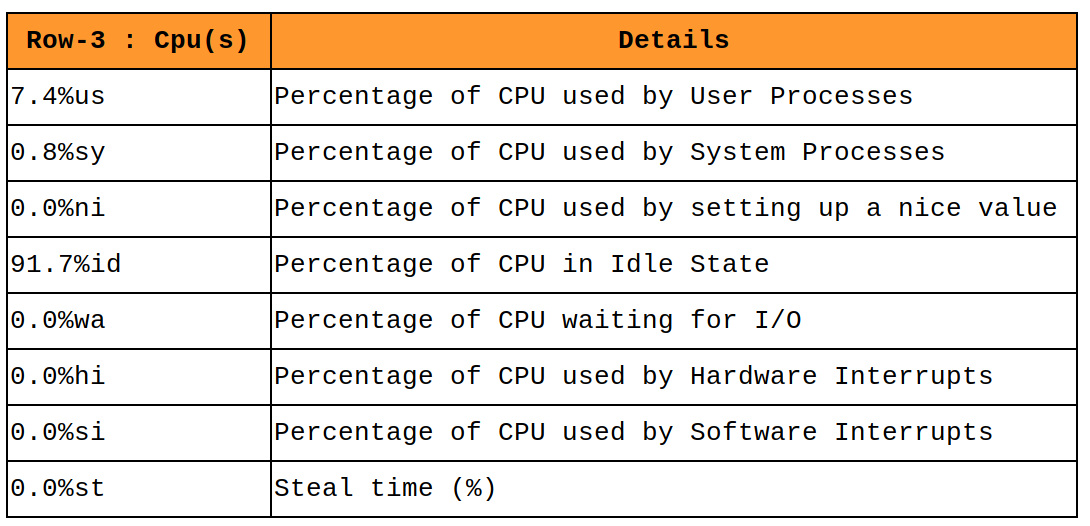
Row-3 output shows the CPU utilization status on the system. It shows Percentage of CPU used by User Process, System Processes, Hardware Interrupts and Software Interrupts. Percentage of CPU in Idle State and Percentage of CPU waiting for I/O. Percentage of CPU used by setting up a nice value.
Steal time is the percentage of time a virtual CPU waits for a real CPU while the hypervisor is servicing another virtual processor.
Cpu(s): 7.4%us, 0.8%sy, 0.0%ni, 91.7%id, 0.0%wa, 0.0%hi, 0.0%si, 0.0%st
Output of Row-4
Row-4 output shows the Memory utilization status on the system. It shows system total memory, current memory utilization, free memory and Total Memory used by Buffers.
Mem: 32949868k total, 13928996k used, 19020872k free, 1323780k buffers
Output of Row-5
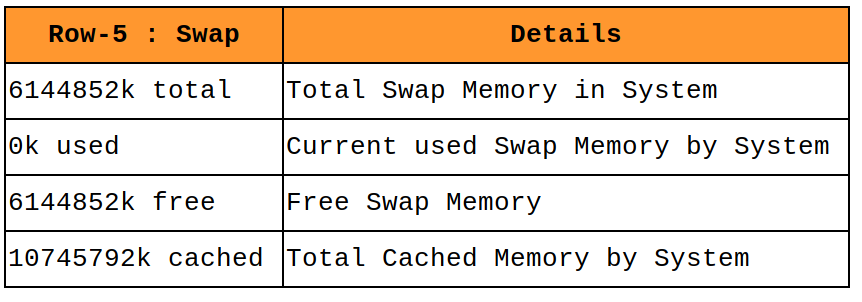
Row-5 output shows the Swap utilization status on the system. It shows total swap memory in system, current swap utilization, free swap memory and Total Cached Memory by System.
Swap: 6144852k total, 0k used, 6144852k free, 10745792k cached
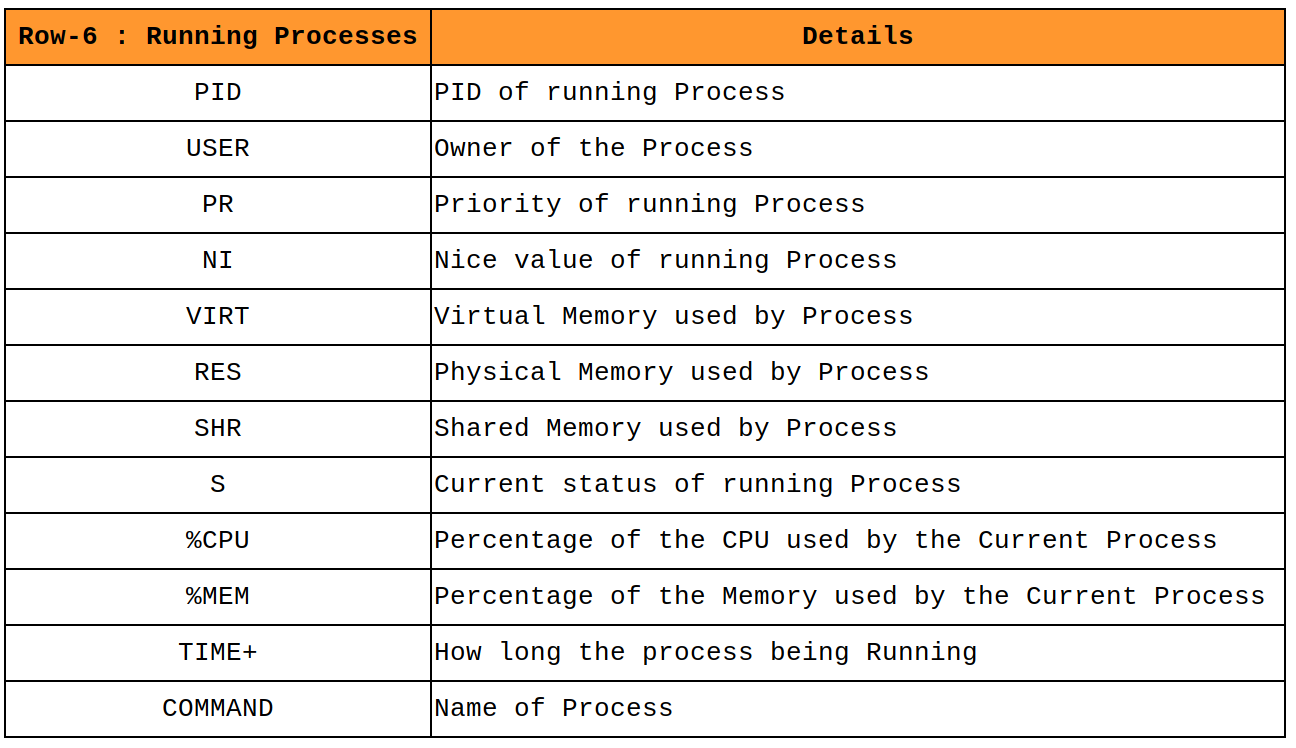
Output of Row-6
Row-6 output shows all running process on the system. Also, it shows many useful information about the process.
PID   USER      PR  NI  VIRT  RES  SHR S %CPU %MEM    TIME+  COMMAND
24963 mysql     15   0 1127m 645m 5444 S 51.8  2.0  11787:24 /usr/sbin/mysqld --basedir=/ --datadir=/var/lib/mysql --user=mysql --log-error=/var/lib/mysql/server.2daygeek.com
How to sort output based on Specific Fields?
Press Shift+O to sort field via field letter, for example press N letter to sort based on memory usage.
Current Sort Field:  X  for window 1:Def
Select sort field via field letter, type any other key to return

  a: PID        = Process Id
  b: PPID       = Parent Process Pid
  c: RUSER      = Real user name
  d: UID        = User Id
  e: USER       = User Name
  f: GROUP      = Group Name
  g: TTY        = Controlling Tty
  h: PR         = Priority
  i: NI         = Nice value
  j: P          = Last used cpu (SMP)
  k: %CPU       = CPU usage
  l: TIME       = CPU Time
  m: TIME+      = CPU Time, hundredths
  n: %MEM       = Memory usage (RES)
  o: VIRT       = Virtual Image (kb)
  p: SWAP       = Swapped size (kb)
  Q: RES        = Resident size (kb)
  r: CODE       = Code size (kb)
  s: DATA       = Data+Stack size (kb)
  t: SHR        = Shared Mem size (kb)
  u: nFLT       = Page Fault count
  v: nDRT       = Dirty Pages count
  w: S          = Process Status
* x: COMMAND    = Command name/line
  y: WCHAN      = Sleeping in Function
  z: Flags      = Task Flags
To Quit top command press q.


