Do you know, what tools are used to troubleshoot or monitor real-time disk I / O performance issues on Linux?
In General, top command will be used to view system performance, when an application performance is slow,
This is the first level of troubleshooting which is widely performed by Linux Administrator in the real world.
If you do not find any performance issues with respect to resource utilization, especially with CPU and Memory, other fields will be opted to identify the bottlenecks.
I would recommend to check the wa field in the top command output to figure out, if there is any high I/O Read & Write operations on the storage devices and partitions (such as Hard disk drives, SSD, and Disk partitions).
Server performance degradation might occur due to high disk Read Write I/O operation on the storage devices and partitions, irrespective of CPU and Memory usage on the system.
If the disk I/O operation is high or fluctuating, it could be a possible cause for performance lag for which the disk I/O statistics on the system has to be verified.
To derive and verify the I/O Statistics in detail, iotop and iostat commands will be used predominantly.
These commands are widely used to identify performance issues with storage devices, including local disks or Network File System.
1) What is iotop?
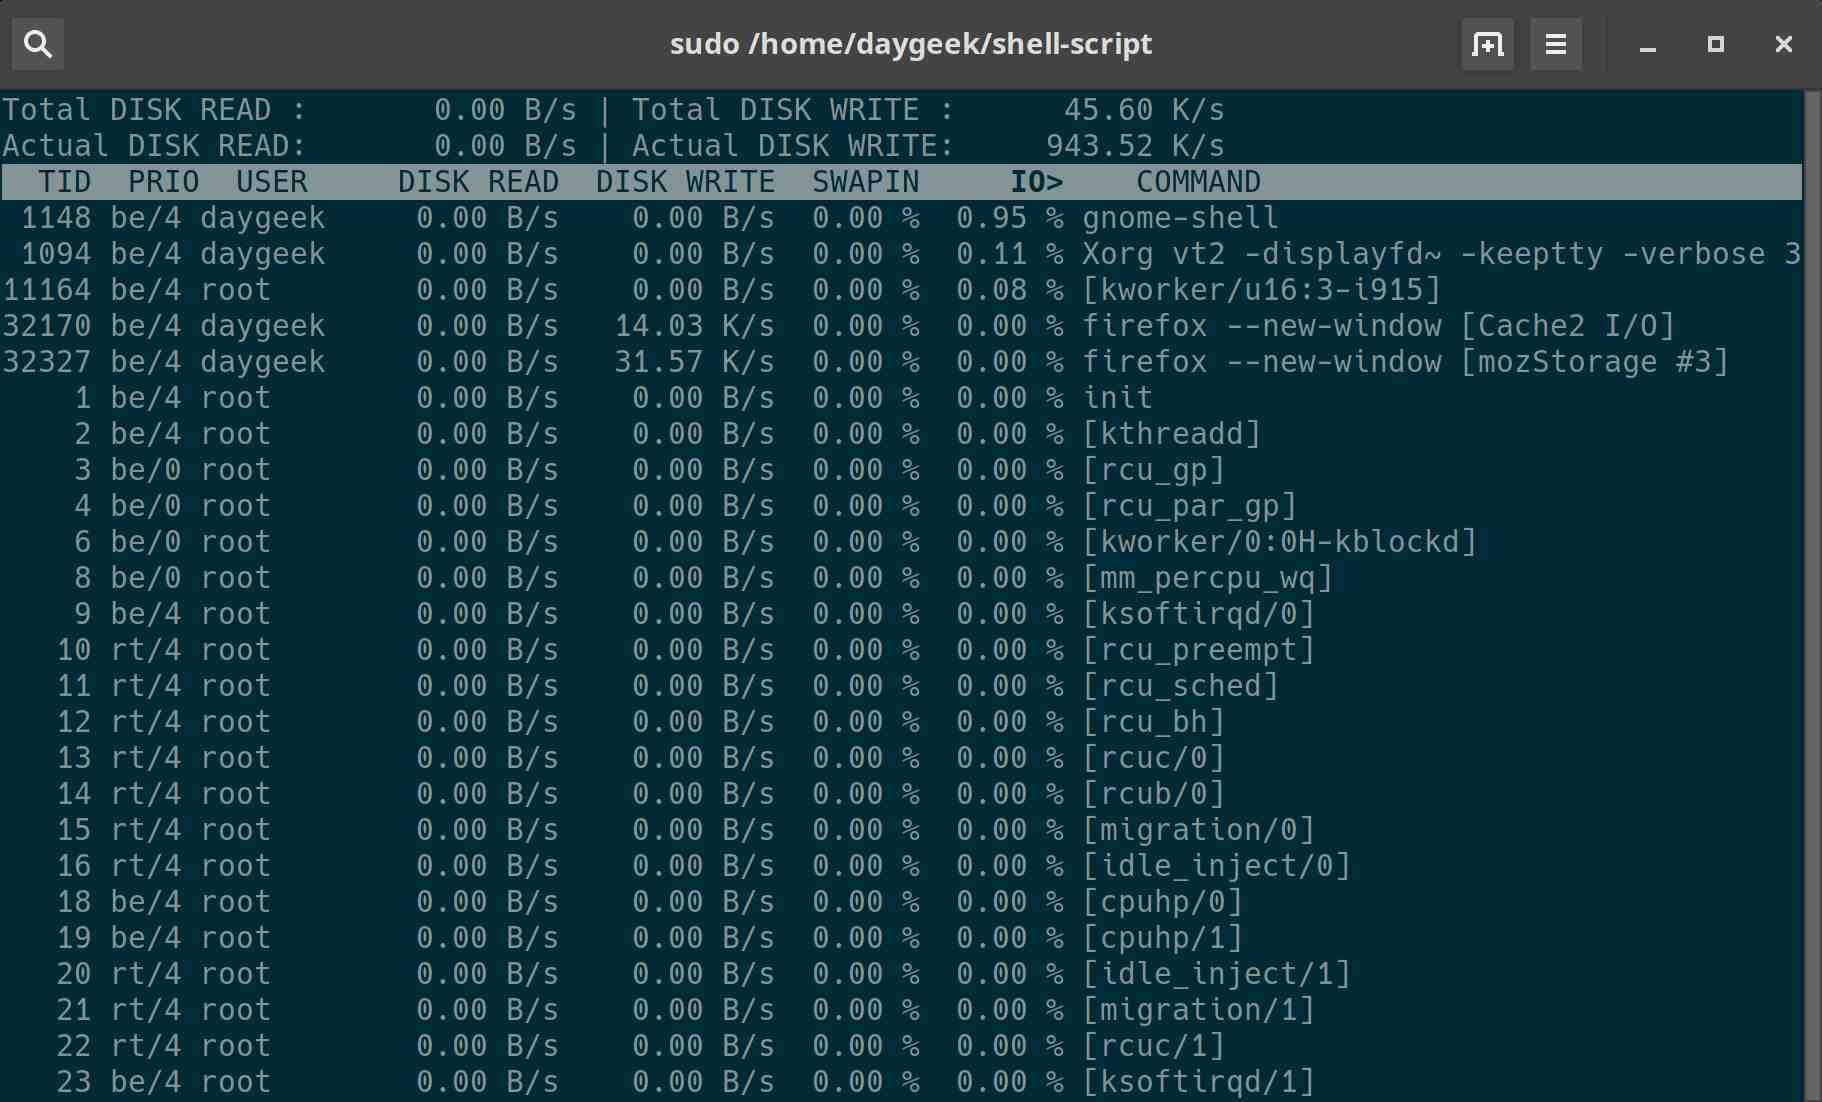
iotop is similar to top command utility, for displaying real-time disk activity.
iotop watches I/O usage information from the Linux kernel and displays a table of current I/O usage through processes or threads on the system.
It displays the I/O bandwidth read and written from each process/thread. It also displays the percentage of time the thread/process spent while swapping or waiting on I/O.
Total DISK READ and Total DISK WRITE values represent total read and write bandwidth between processes and kernel threads on one side and kernel block device subsystem on the other side.
Actual DISK READ and Actual DISK WRITE values represent corresponding bandwidths for actual disk I/O between kernel block device subsystem and underlying hardware’s (HDD, SSD, etc.).
1.1) iotop installation in Linux
We can easily install it with help of a package manager since the package is available in all the Linux distributions repositories.
For Fedora and RHEL/CentOS 8 system, use DNF Command to install iotop.
$ sudo dnf install iotop
For Debian/Ubuntu systems, use APT-GET Command or APT Command to install iotop.
$ sudo apt install iotop
For Arch Linux based systems, use Pacman Command to install iotop.
$ sudo pacman -S iotop
For RHEL/CentOS 6/7 systems, use YUM Command to install iotop.
$ sudo yum install iotop
For openSUSE Leap system, use Zypper Command to install iotop.
$ sudo zypper install iotop
1.2) Monitoring Disk I/O activity using iotop command
Many options are available in iotop command to check the various statistics about the disk I/O.
Run the iotop command without any arguments, to see each process or threads about current I/O usage.
# iotop
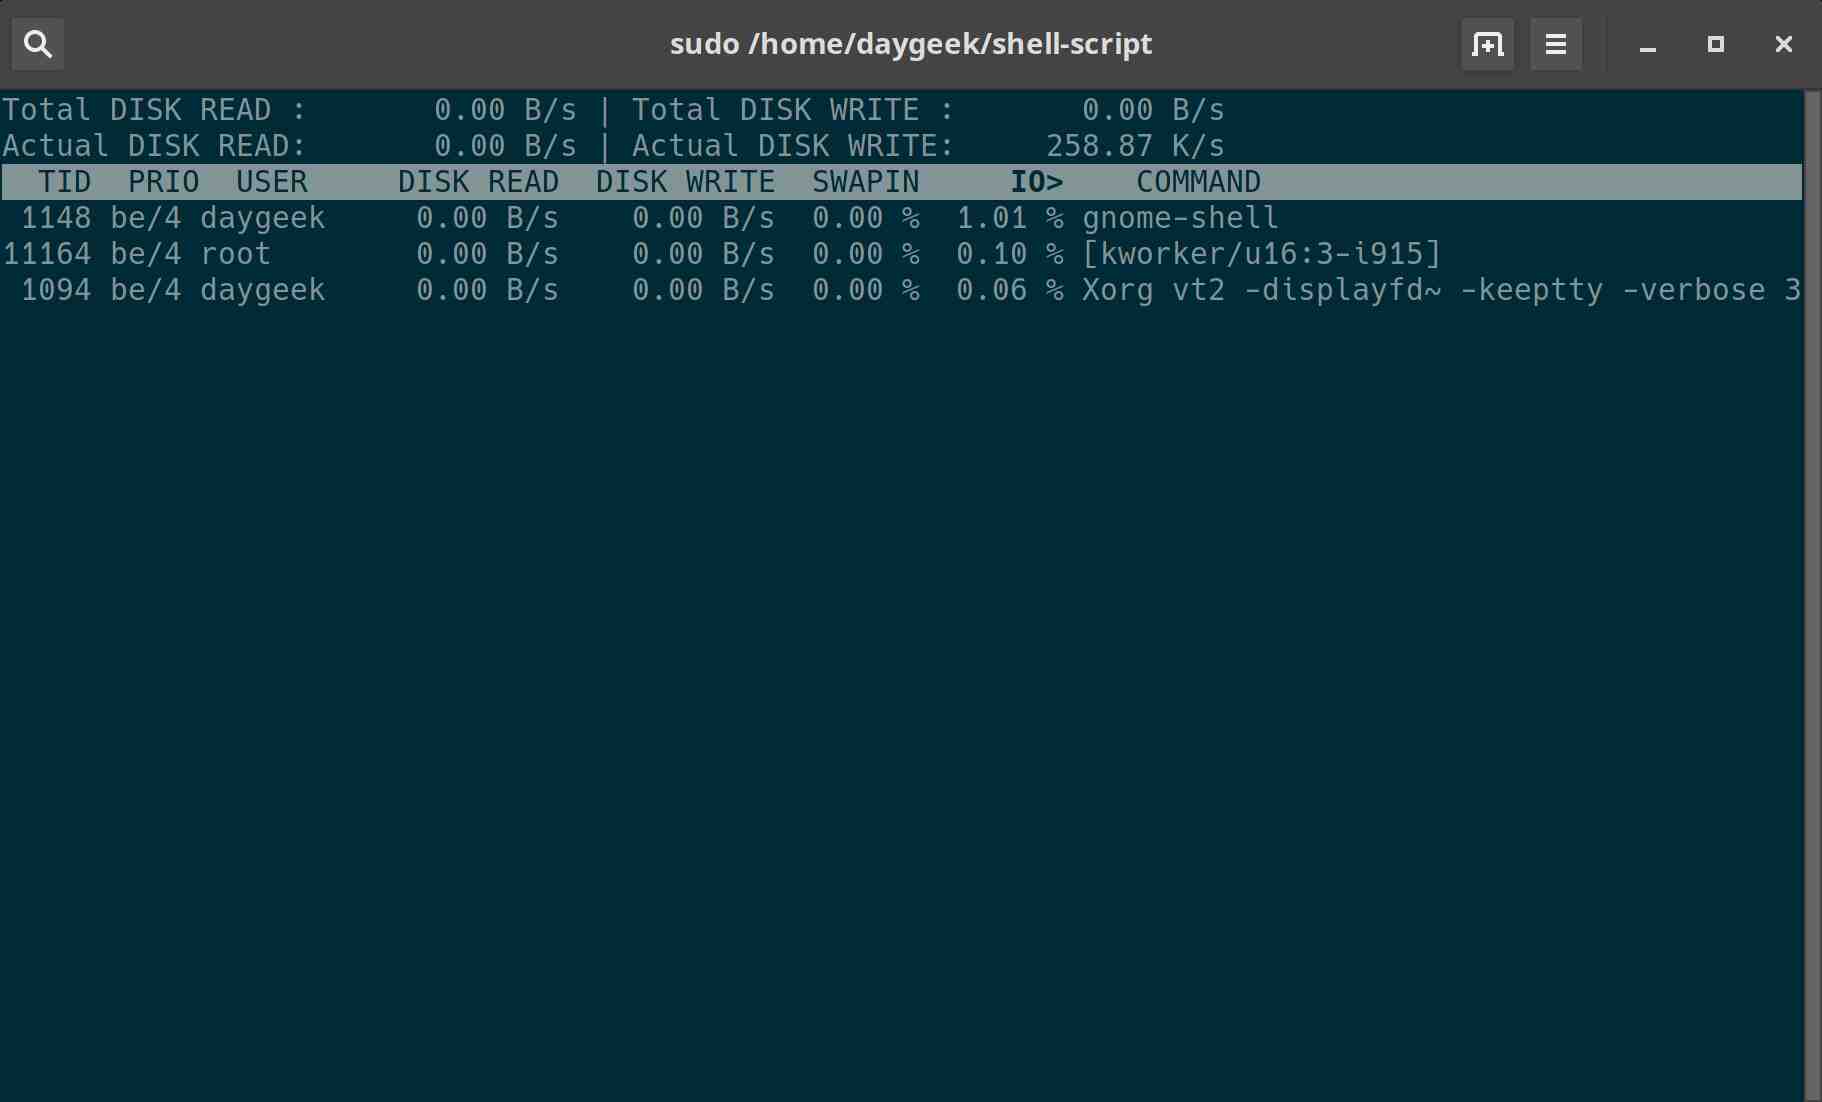
To check which processes are actually utilizing the disk IO, run the iotop command with -o or –only option to visualize it.
# iotop --only
Details:
IO:It shows Input/Output utilization of each process, which includes disk and swap.SWAPIN:It shows only the swap usage of each process.
2) What is iostat?
iostat is used to report Central Processing Unit (CPU) statistics and input/output statistics for devices and partitions.
The iostat command is used to monitor system input/output device loading by observing the time the devices are active in relation to their average transfer rates.
The iostat command generates reports that can be used to change system configuration to better balance the input/output load between physical disks.
All statistics are reported when the iostat command runs every time. On multiprocessor systems, CPU statistics are calculated system-wide as average among all processors.
The iostat command generates two types of reports,
- CPU Utilization report
- Device Utilization report.
2.1) How to install iostat in Linux?
iostat tool is part of sysstat package which can be installed from the official Linux distributions repository.
On Fedora and CentOS/RHEL 8
$ sudo dnf install sysstat
On Debian/Ubuntu
$ sudo apt install sysstat
On Arch Linux
$ sudo pacman -S sysstat
On RHEL/CentOS 6/7
$ sudo yum install sysstat
On openSUSE
$ sudo zypper install sysstat
2.2) Measuring Disk I/O performance with sysstat command
Many options are available in iostat command to check the various statistics about disk I/O and CPU.
Run the iostat command without any arguments to see the complete statistics of the system.
# iostat

Linux 4.19.32-1-MANJARO (daygeek-Y700) 	Thursday 18 April 2019 	_x86_64_	(8 CPU)

avg-cpu:  %user   %nice %system %iowait  %steal   %idle
          29.45    0.02   16.47    0.12    0.00   53.94

Device             tps    kB_read/s    kB_wrtn/s    kB_dscd/s    kB_read    kB_wrtn    kB_dscd
nvme0n1           6.68       126.95       124.97         0.00   58420014   57507206          0
sda               0.18         6.77        80.24         0.00    3115036   36924764          0
loop0             0.00         0.00         0.00         0.00       2160          0          0
loop1             0.00         0.00         0.00         0.00       1093          0          0
loop2             0.00         0.00         0.00         0.00       1077          0          0
Run the iostat command with -d option, to see the I/O statistics of all the devices.
# iostat -d

Linux 4.19.32-1-MANJARO (daygeek-Y700) 	Thursday 18 April 2019 	_x86_64_	(8 CPU)

Device             tps    kB_read/s    kB_wrtn/s    kB_dscd/s    kB_read    kB_wrtn    kB_dscd
nvme0n1           6.68       126.95       124.97         0.00   58420030   57509090          0
sda               0.18         6.77        80.24         0.00    3115292   36924764          0
loop0             0.00         0.00         0.00         0.00       2160          0          0
loop1             0.00         0.00         0.00         0.00       1093          0          0
loop2             0.00         0.00         0.00         0.00       1077          0          0
Run the iostat command with -p option, to see the I/O statistics of all the devices and their partitions.
# iostat -p

Linux 4.19.32-1-MANJARO (daygeek-Y700) 	Thursday 18 April 2019 	_x86_64_	(8 CPU)

avg-cpu:  %user   %nice %system %iowait  %steal   %idle
          29.42    0.02   16.45    0.12    0.00   53.99

Device             tps    kB_read/s    kB_wrtn/s    kB_dscd/s    kB_read    kB_wrtn    kB_dscd
nvme0n1           6.68       126.94       124.96         0.00   58420062   57512278          0
nvme0n1p1         6.40       124.46       118.36         0.00   57279753   54474898          0
nvme0n1p2         0.27         2.47         6.60         0.00    1138069    3037380          0
sda               0.18         6.77        80.23         0.00    3116060   36924764          0
sda1              0.00         0.01         0.00         0.00       3224          0          0
sda2              0.18         6.76        80.23         0.00    3111508   36924764          0
loop0             0.00         0.00         0.00         0.00       2160          0          0
loop1             0.00         0.00         0.00         0.00       1093          0          0
loop2             0.00         0.00         0.00         0.00       1077          0          0
Run the iostat command with -x option, to see the detailed I/O statistics of all the devices.
# iostat -x

Linux 4.19.32-1-MANJARO (daygeek-Y700) 	Thursday 18 April 2019 	_x86_64_	(8 CPU)

avg-cpu:  %user   %nice %system %iowait  %steal   %idle
          29.41    0.02   16.45    0.12    0.00   54.00

Device            r/s     rkB/s   rrqm/s  %rrqm r_await rareq-sz     w/s     wkB/s   wrqm/s  %wrqm w_await wareq-sz     d/s     dkB/s   drqm/s  %drqm d_await dareq-sz  aqu-sz  %util
nvme0n1          2.45    126.93     0.60  19.74    0.40    51.74    4.23    124.96     5.12  54.76    3.16    29.54    0.00      0.00     0.00   0.00    0.00     0.00    0.31  30.28
sda              0.06      6.77     0.00   0.00    8.34   119.20    0.12     80.23    19.94  99.40   31.84   670.73    0.00      0.00     0.00   0.00    0.00     0.00    0.00   0.13
loop0            0.00      0.00     0.00   0.00    0.08    19.64    0.00      0.00     0.00   0.00    0.00     0.00    0.00      0.00     0.00   0.00    0.00     0.00    0.00   0.00
loop1            0.00      0.00     0.00   0.00    0.40    12.86    0.00      0.00     0.00   0.00    0.00     0.00    0.00      0.00     0.00   0.00    0.00     0.00    0.00   0.00
loop2            0.00      0.00     0.00   0.00    0.38    19.58    0.00      0.00     0.00   0.00    0.00     0.00    0.00      0.00     0.00   0.00    0.00     0.00    0.00   0.00
Run the iostat command with -d [Device_Name] option, to see the I/O statistics of particular device and their partitions.
# iostat -p [Device_Name]

# iostat -p sda

Linux 4.19.32-1-MANJARO (daygeek-Y700) 	Thursday 18 April 2019 	_x86_64_	(8 CPU)

avg-cpu:  %user   %nice %system %iowait  %steal   %idle
          29.38    0.02   16.43    0.12    0.00   54.05

Device             tps    kB_read/s    kB_wrtn/s    kB_dscd/s    kB_read    kB_wrtn    kB_dscd
sda               0.18         6.77        80.21         0.00    3117468   36924764          0
sda2              0.18         6.76        80.21         0.00    3112916   36924764          0
sda1              0.00         0.01         0.00         0.00       3224          0          0
Run the iostat command with -m option, to see the I/O statistics with MB for all the devices instead of KB.
By default, it shows the output in KB.
# iostat -m

Linux 4.19.32-1-MANJARO (daygeek-Y700) 	Thursday 18 April 2019 	_x86_64_	(8 CPU)

avg-cpu:  %user   %nice %system %iowait  %steal   %idle
          29.36    0.02   16.41    0.12    0.00   54.09

Device             tps    MB_read/s    MB_wrtn/s    MB_dscd/s    MB_read    MB_wrtn    MB_dscd
nvme0n1           6.68         0.12         0.12         0.00      57050      56176          0
sda               0.18         0.01         0.08         0.00       3045      36059          0
loop0             0.00         0.00         0.00         0.00          2          0          0
loop1             0.00         0.00         0.00         0.00          1          0          0
loop2             0.00         0.00         0.00         0.00          1          0          0
Run the iostat command at certain interval, using the below format. In this example, totally two reports at five seconds interval will be captured.
# iostat [Interval] [Number Of Reports]

# iostat 5 2

Linux 4.19.32-1-MANJARO (daygeek-Y700) 	Thursday 18 April 2019 	_x86_64_	(8 CPU)

avg-cpu:  %user   %nice %system %iowait  %steal   %idle
          29.35    0.02   16.41    0.12    0.00   54.10

Device             tps    kB_read/s    kB_wrtn/s    kB_dscd/s    kB_read    kB_wrtn    kB_dscd
nvme0n1           6.68       126.89       124.95         0.00   58420116   57525344          0
sda               0.18         6.77        80.20         0.00    3118492   36924764          0
loop0             0.00         0.00         0.00         0.00       2160          0          0
loop1             0.00         0.00         0.00         0.00       1093          0          0
loop2             0.00         0.00         0.00         0.00       1077          0          0

avg-cpu:  %user   %nice %system %iowait  %steal   %idle
           3.71    0.00    2.51    0.05    0.00   93.73

Device             tps    kB_read/s    kB_wrtn/s    kB_dscd/s    kB_read    kB_wrtn    kB_dscd
nvme0n1          19.00         0.20       311.40         0.00          1       1557          0
sda               0.20        25.60         0.00         0.00        128          0          0
loop0             0.00         0.00         0.00         0.00          0          0          0
loop1             0.00         0.00         0.00         0.00          0          0          0
loop2             0.00         0.00         0.00         0.00          0          0          0
Run the iostat command with -N option, to see the LVM disk I/O statistics report.
# iostat -N

Linux 4.15.0-47-generic (Ubuntu18.2daygeek.com) 	Thursday 18 April 2019 	_x86_64_	(2 CPU)

avg-cpu:  %user   %nice %system %iowait  %steal   %idle
           0.38    0.07    0.18    0.26    0.00   99.12

Device             tps    kB_read/s    kB_wrtn/s    kB_read    kB_wrtn
sda               3.60        57.07        69.06     968729    1172340
sdb               0.02         0.33         0.00       5680          0
sdc               0.01         0.12         0.00       2108          0
2g-2gvol1         0.00         0.07         0.00       1204          0
Run the nfsiostat command, to see the I/O statistics for Network File System(NFS).
# nfsiostat
Conclusion
This article briefs about the disk performance troubleshooting using iostat and iotop commands, besides regular top command usage.
Please support us by sharing this article among the social community groups or technical forums.


