As a system administrator, you might know & use few utilities for network troubleshooting and performance tuning but in Linux we have many other options to use (I mean you will get a bunch of utilities for same purpose but each has their own feature which will give you more option for better troubleshooting).
Say hello to netutils-linux is a collection of utilities to perform network troubleshooting and performance tuning in varies aspect.
This tool automate the whole Linux network performance tuning process out of box. All these utilities doesn’t require root or sudo privileges. So you can install and use them as non-privileged user like top.
Suggested Read :
(#) vnStat – A lightweight (Command Line) Network Traffic Monitoring Tool
(#) bmon – Real Time Bandwidth Monitor and Rate Estimator in Linux
(#) nload – Monitor Network Traffic And Bandwidth Usage In Real Time
netutils-linux tool contain following utilities.
- NetworkTop
- SnmpTop
- Irqtop
- SoftnetStatTop
- LinkRateTop
- Softirqs
- RxBuffers
- RSSLadder
- AutoSoftirqTune
- ServerInfo
- maximize-cpu-freq
These utilities are categorized into three sections as follow.
- Monitoring
- Tuning
- Hardware and its configuration rating
How to install netutils-linux in Linux
It can be install through pip package to all major Linux distributions. In order to install netutils-linux, Make sure your system have python and python-pip packages as a prerequisites.
pip is a python module bundled with setuptools, it’s one of the recommended tool for installing Python packages in Linux.
For Debian/Ubuntu, use apt-get command or apt command to install pip.
$ sudo apt install python-pip
For RHEL/CentOS, use YUM command to install pip.
$ sudo yum install python-pip python-devel
For Fedora, use dnf command to install pip.
$ sudo dnf install python-pip
For Arch Linux, use pacman Command to install pip.
$ sudo pacman -S python-pip
For openSUSE, use Zypper Command to install pip.
$ sudo pacman -S python-pip
Finally, Run the following pip command to install netutils-linux.
$ sudo pip install netutils-linux
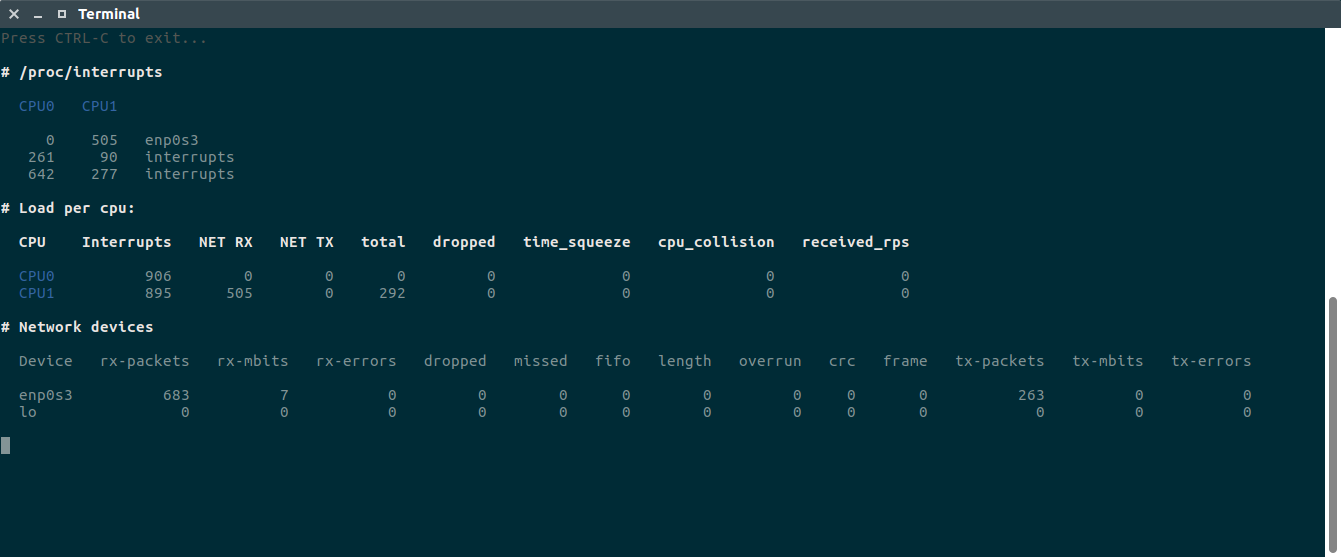
1) NetworkTop
All the top utilities are inherited from BaseTop. This utility includes most of the network stack performance metrics and allow users to monitor interrupts, soft interrupts, network processing statistic for devices and CPUs by gathering information from following files /proc/interrupts, /proc/net/softnet_stat, /proc/softirqs, and /sys/class/net//statistic/
$ network-top
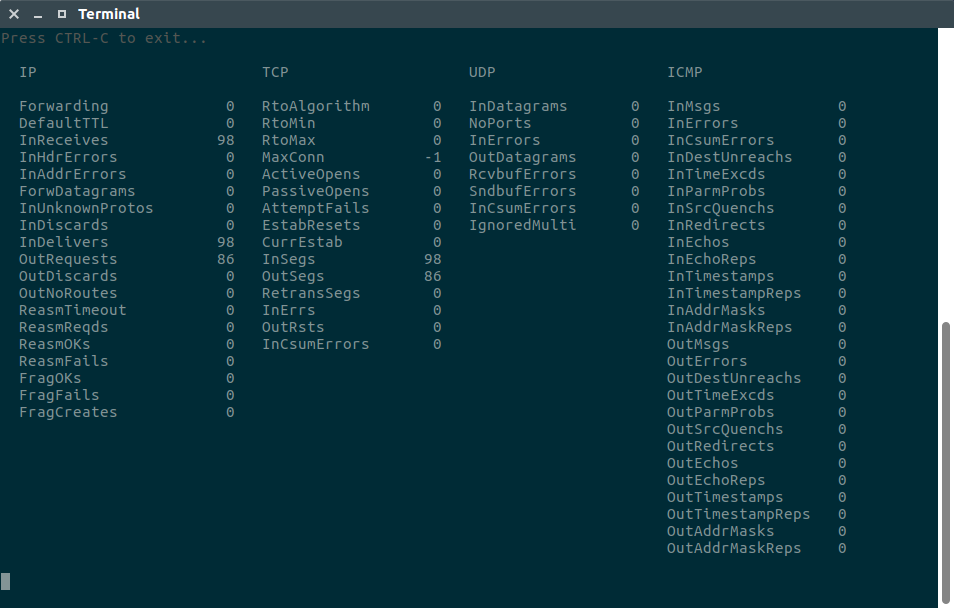
2) SnmpTop
The /proc/net/snmp file displays data that is used by snmp agents for IP, ICMP, TCP and UDP monitoring and management. This can help administrators to identify unusual values and thereby identify potential performance problems. In other hands we can say, Basic /proc/net/smmp file watcher.
$ snmptop
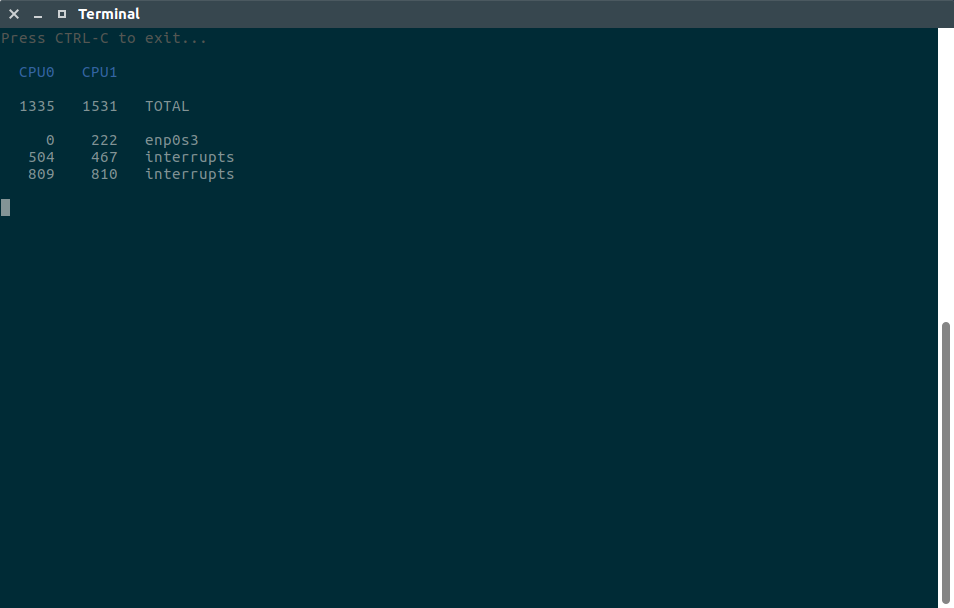
3) Irqtop
Irqtop is a part of NetworkTop package. If you want to display only irqs metrics, use the below command. Basically it’s gathering the information from /proc/interrupts file.
This file records the number of interrupts per IRQ. The first column refers to the IRQ number. Each CPU in the system has its own column and its own number of interrupts per IRQ. The next column reports the type of interrupt, and the last column contains the name of the device that is located at that IRQ.
$ irqtop
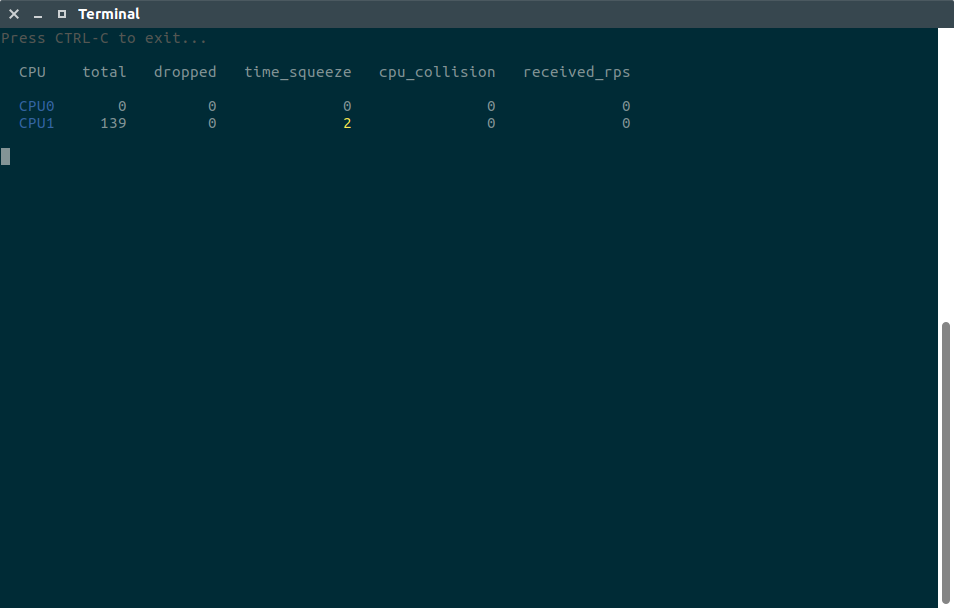
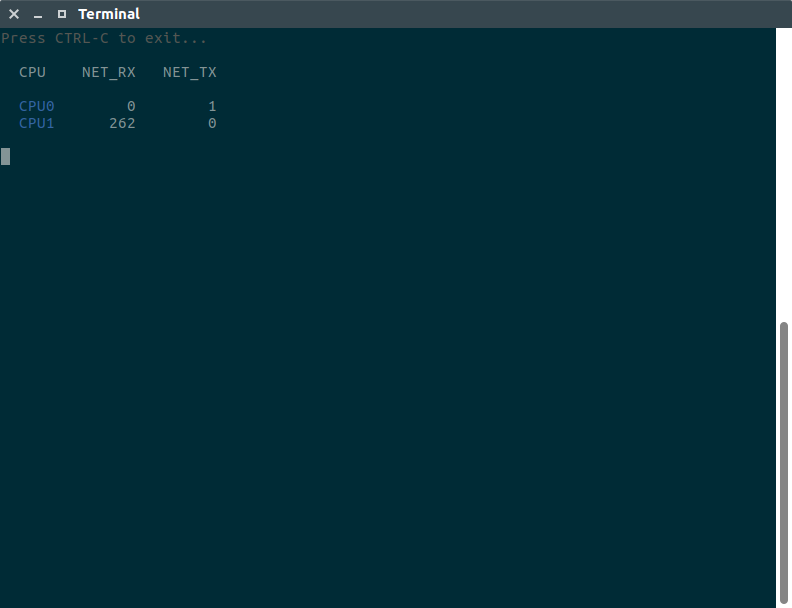
4) SoftnetStatTop
The file /proc/net/softnet_stat provides statistics on each CPU core’s errors/squeeze rate.
$ softnet-stat-top
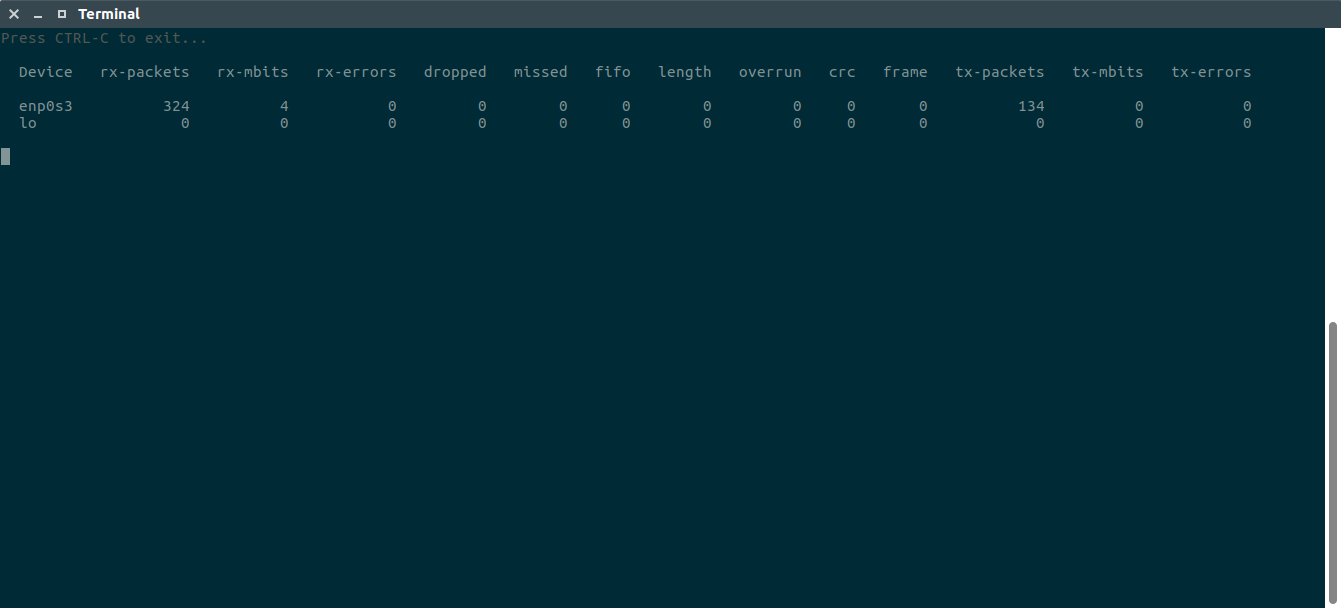
5) LinkRateTop
This utility displays no of packets received/transmitted and errors information based on /sys/class/net//statistic/
$ link-rate
6) Softirqs
This summarizes the time spent servicing soft IRQs (soft interrupts) and soft IRQ event counts (but not times) are available in /proc/softirqs.
$ softirq-top
7) RxBuffers
By default buffering values set for NICs are 256 or 512 bytes. Run the following command to view the capability and the current values of your interface. I could see that both RX and TX values are set to 256 but the interface have the capability of 4096 bytes.
$ ethtool -g enp0s3
Ring parameters for enp0s3:
Pre-set maximums:
RX:		4096
RX Mini:	0
RX Jumbo:	0
TX:		4096
Current hardware settings:
RX:		4096
RX Mini:	0
RX Jumbo:	0
TX:		4096
To increase receive (TX) and transmit (RX) buffers on network interface, run the following command for high performances. In order to use this utility, make sure it should be installed on your system.
$ sudo ethtool -G enp0s3 rx 2048 tx 2048
8) RSSLadder
This automatically set smp_affinity_list for IRQ of NIC rx/tx queues that usually work on CPU0 out of the box.
$ rss-ladder enp0s3 0
9) AutoSoftirqTune
Enables RPS on all available CPUs of NUMA node local for the NIC for all NIC’s rx queues. It may be good for small servers with cheap network cards. You also can explicitly pass –cpus or –cpu-mask .
$ sudo autorps enp0s3
Using mask '3' for enp0s3-rx-0
10) maximize-cpu-freq
Sets every CPU scaling governor mode to performance and set max scaling value for min scaling value. So you will be able to use all power of your processor (useful for latency sensible systems).
11) ServerInfo
It used to display system hardware information alike lshw tool. To know more about lshw tool, navigate to following link.
Suggested Read :
(#) LSHW (Hardware Lister) – A Nifty Tool To Get A Hardware Information On Linux
(#) inxi – A Great Tool to Check Hardware Information on Linux
(#) Dmidecode – Easy Way To Get Linux System Hardware Information
(#) hwinfo (Hardware Info) – A Nifty Tool To Detect System Hardware Information On Linux
(#) Neofetch – Shows Linux System Information With ASCII Distribution Logo
(#) ScreenFetch – Fetch Linux System Information on Terminal with Distribution ASCII art logo
(#) 16 Methods To Check If A Linux System Is Physical or Virtual Machine
$ sudo server-info show
cpu:
  info:
    Architecture: x86_64
    BogoMIPS: 5183
    Byte Order: Little Endian
    CPU MHz: 2591
    CPU family: 6
    CPU op-mode(s): 32-bit, 64-bit
    CPU(s): 2
    Core(s) per socket: 2
    Flags: fpu vme de pse tsc msr pae mce cx8 apic sep mtrr pge mca cmov pat pse36
      clflush mmx fxsr sse sse2 ht syscall nx rdtscp lm constant_tsc rep_good nopl
      xtopology nonstop_tsc pni pclmulqdq ssse3 cx16 sse4_1 sse4_2 x2apic movbe popcnt
      aes xsave avx rdrand hypervisor lahf_lm abm 3dnowprefetch rdseed clflushopt
    Hypervisor vendor: KVM
    L1d cache: 32K
    L1i cache: 32K
    L2 cache: 256K
    L3 cache: 6144K
    Model: 94
    Model name: Intel(R) Core(TM) i7-6700HQ CPU @ 2.60GHz
    NUMA node(s): 1
    NUMA node0 CPU(s): 0,1
    On-line CPU(s) list: 0,1
    Socket(s): 1
    Stepping: 3
    Thread(s) per core: 1
    Vendor ID: GenuineIntel
    Virtualization type: full
  layout:
    '0': '0'
    '1': '0'
disk:
  sda:
    model: 'VBOX HARDDISK   '
    size: 32212254720
    type: HDD
  sr0:
    model: CD-ROM
memory:
  MemFree: 78940
  MemTotal: 2045788
  SwapFree: 1329200
  SwapTotal: 1459804
net:
  enp0s3:
    buffers:
      cur: 2048
      max: 4096
    conf:
      ip: ''
      vlan: false
    driver:
      driver: e1000
      version: 7.3.21-k8-NAPI
    queues:
      own: []
      rx: []
      rxtx: []
      shared:
      - 19-fasteoi ehci_hcd:usb1, enp0s3
      tx: []
      unknown: []
The below command can rate hardware and its features in range of 1 to 10.
$ sudo server-info rate
cpu:
  BogoMIPS: 4
  CPU MHz: 4
  CPU(s): 1
  Core(s) per socket: 10
  L3 cache: 3
  Socket(s): 1
  Thread(s) per core: 10
  Vendor ID: 10
disk:
  sda:
    size: 1
    type: 1
  sr0:
    size: 1
    type: 2
memory:
  MemTotal: 1
  SwapTotal: 3
net:
  enp0s3:
    buffers:
      cur: 5
      max: 10
    driver: 3
    queues: 1
system:
  Hypervisor vendor: 1
  Virtualization type: 1