As of now, we have covered plenty of command line system monitoring tools which is capable to print various system performance information with numeric values and doesn’t offers any graph.
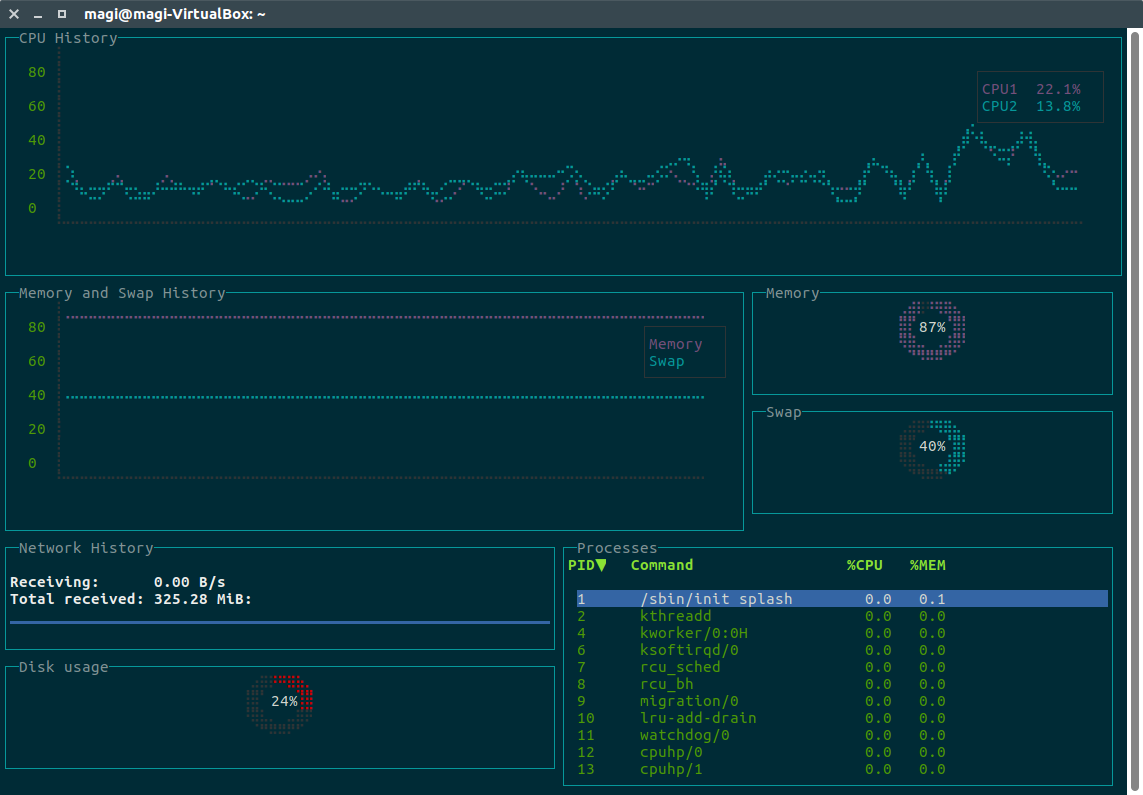
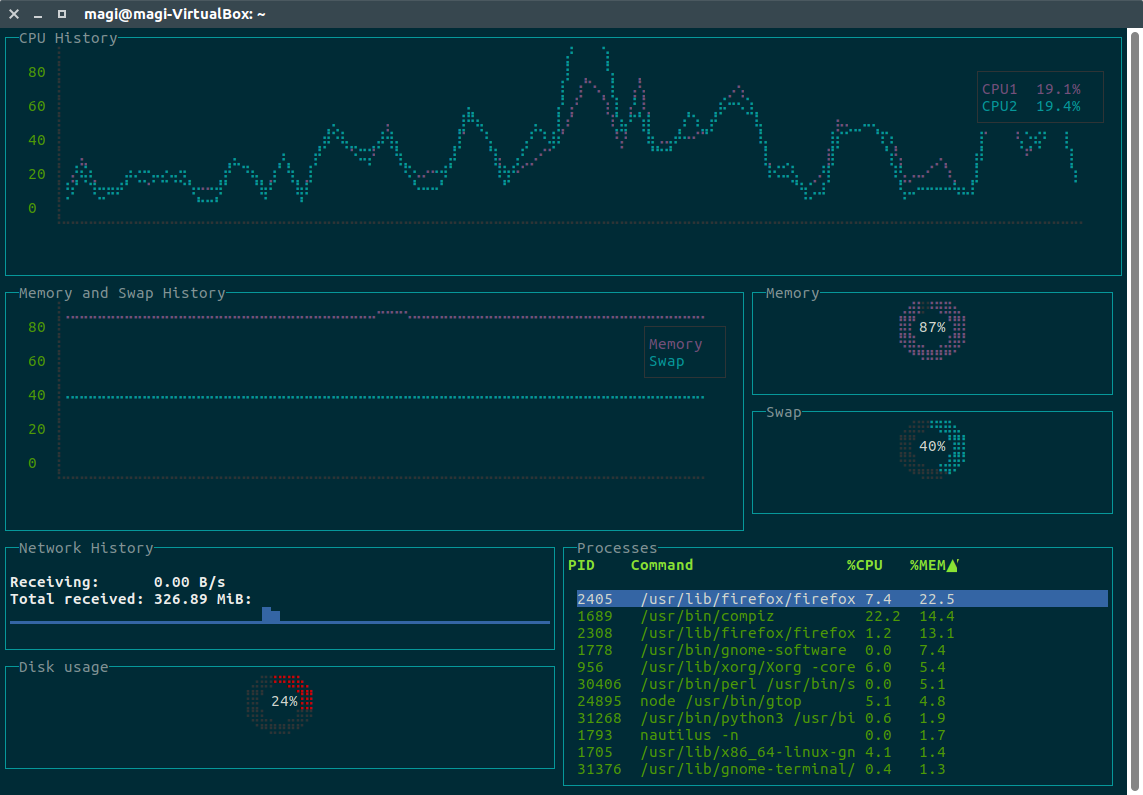
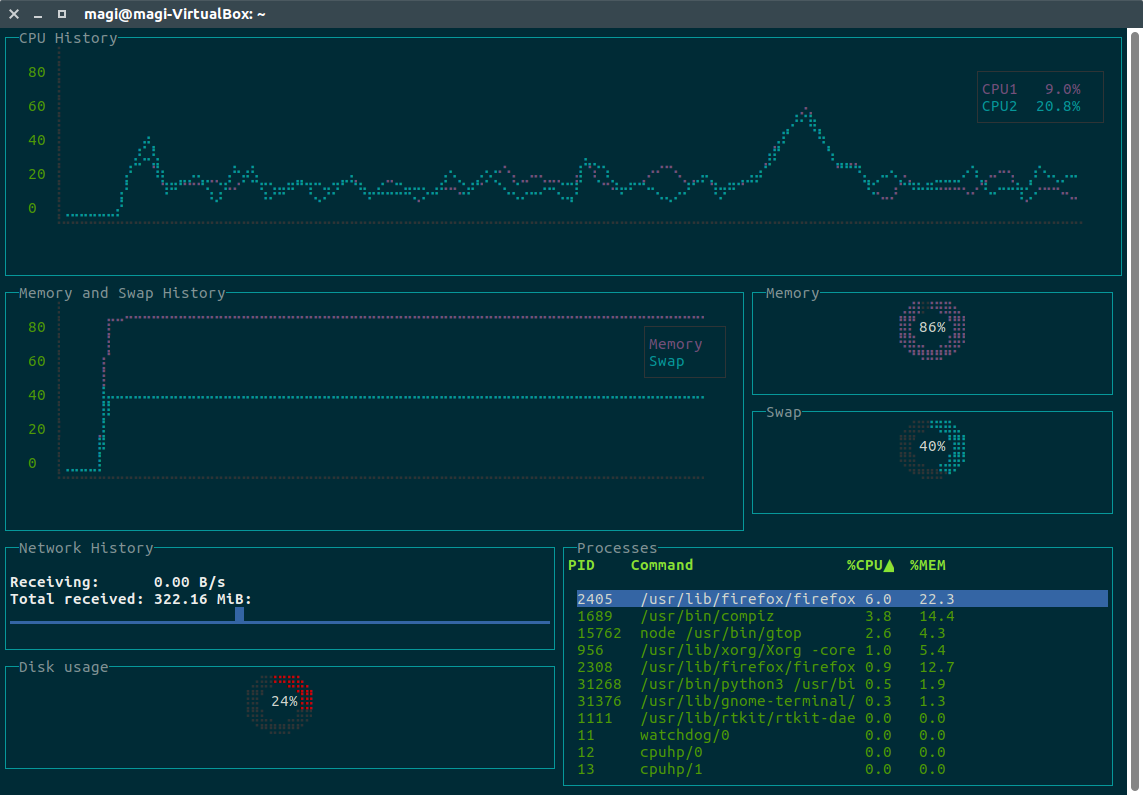
Today, we came to know about Gtop, is one of the nifty tool that is capable to display system processes dynamically in graphic mode on your Linux terminal.
As the name implies, Gtop stands for graphic top command which reads system process, memory, CPU, network and disk usage information and populate the results in graphic mode with a percentage.
Install prerequisites
Make sure your system have Node.js, in order to install Gtop. If not, follow the below steps to install it. Node.js is a JavaScript runtime built on Chrome’s V8 JavaScript engine which.
For CentOS/RHEL systems, use yum command to install Nodejs and npm.
$ curl --silent --location https://rpm.nodesource.com/setup_8.x | sudo bash -
$ sudo yum -y install nodejs
For Fedora systems, use dnf command to install Nodejs and npm.
$ curl --silent --location https://rpm.nodesource.com/setup_8.x | sudo bash -
$ sudo dnf -y install nodejs
For Ubuntu/LinuxMint systems, use apt-get command or apt command to install Nodejs and npm.
$ curl -sL https://deb.nodesource.com/setup_8.x | sudo -E bash -
$ sudo apt-get install -y nodejs
For Debian system, use apt command or apt-get command to install Nodejs and npm.
$ curl -sL https://deb.nodesource.com/setup_8.x | bash -
$ sudo apt-get install -y nodejs
For Arch Linux based systems, use pacman command to install Nodejs and npm.
$ sudo pacman -S nodejs npm
For openSUSE system, use zypper command to install Nodejs and npm.
$ sudo zypper install nodejs4
Install Gtop
simply run the following command to install Gtop on Linux.
$ sudo npm install gtop -g
How to use Gtop
Just fire gtop command on terminal to bring the awesome graphical system monitoring dashboard on terminal. By default it load process based on CPU utilization.
$ gtop
Gtop allows user to sort the process table by pressing below keywords.
- p : Process Id
- c : CPU usage
- m : Memory usage
- UP/DOWN Arrow Keys : Use UP/DOWN arrow keys to navigate top to bottom of running process
Processes sorted by Process ID.

Processes sorted by Memory utilization.

Note: When you see question marks or other different characters, try to run it with these environment variables.
$ LANG=en_US.utf8 TERM=xterm-256color gtop


can’t get a second drive two show up in the panel