Monitorix is a free, open source, lightweight system monitoring tool designed to monitor server, service and devices. Monitorix was developed for UNIX/LINUX servers, but due to its simplicity and small size it can be used on embedded devices as well. Monitorix project proudly announced the new release of Monitorix 3.8.1 on November 13, 2015. Also you can read Monitorix Installation on CentOS, RHEL & Fedora. Alternatively you can install other network monitoring tools such as Zabbix, Nagios, Cacti, Munin & Icinga2.
Monitorix uses two programs mainly 1) monitorix & 2) monitorix.cgi, a collector, called monitorix, which is a Perl daemon that is started automatically like any other system service, and a CGI script called monitorix.cgi. Since 3.0 version Monitorix includes its own HTTP server built in, so you aren’t forced to install a third-party web server to use it.
All of its development was initially created for monitoring Red Hat, Fedora and CentOS Linux systems, so this project was made by keeping in mind these type of distributions. Today it runs on different GNU/Linux distributions and even in other UNIX systems like FreeBSD, OpenBSD and NetBSD.
It is currently in active development adding new features, new graphs and correcting bugs in the attempt to offer a great tool for daily systems administration.
Monitorix Features
- Added a complete statistical VerliHub (verlihub) graph.
- Added a complete graph for Varnish proxy cache.
- Improved ‘port’ option documentation of the Nginx graph in the main page of monitorix.conf.
- Improved ” option documentation of the FS graph in the main page of monitorix.conf.
- Improved the way how the process names are detected in Process.pm module.
- Now the output of the ‘command’ parameter in the ‘ps’ command is used to match the process names.
- Zoomed graphs now honour the ‘global_zoom’ option, and also use the function RRDs::graphv to fit better in the browser pop up window. This is a feature only visible with RRDtool v1.3 or more.
- Added an advice in ‘htpasswd.pl’ and ‘monitorix.conf(5)’ to not to use the character colon ‘:’ as part of the name or password since this character is used as field separator.
- Added support for IPv6 in ‘ports’ graph using protocols ‘tcp6’ and ‘upd6’.
- Port graph now uses the wait lock option (‘–wait’) in newer ‘iptables’ versions.
- Added Dutch translation to monthly reports.
- Removed the option ‘all’ as network protocol in the ‘port’ graph.
- Fixed some bugs in the new Makefile.
- Varnish cache 4.0 version supported
- Fixed kernel version detection in FreeBSD 10.x which affected the Network graph.
- Fixed missing HTML tag terminations in several modules.
- Fixed the color in the footer URLs in Multihost mode.
- Fixed a ‘403 Forbidden’ message in Apache generated by a misconfiguration in ‘monitorix-apache.conf’.
- Fixed a bug in ‘netstat’ module that prevented, in some cases, counting correctly the opened connections either in IPv4 and IPv6.
- Fixed a missing CDEF that prevented creating the ‘process05z.png’ graph when the option ‘show_gaps’ was enabled.
- Fixed a bug in ‘squid.pm’ module that prevented from seeing values in the network protocols usage graph.
- Fixed to remove red background color in ‘port’ graph when the network port is enabled for outgoing connections.
- Fixed to increase the timeout in ’emailreports’ from 30 to 120 seconds.
- Monitorix Features
1) Install required packages to Debian Based System
Install below prerequisite packages to Debian based system such as Debian, Ubuntu & Mint.
# Install prerequisite packages for Monitorix #
$ sudo apt-get install rrdtool perl libwww-perl libmailtools-perl libmime-lite-perl librrds-perl libdbi-perl libxml-simple-perl libhttp-server-simple-perl libconfig-general-perl libio-socket-ssl-perl
2) Install monitorix packages
Install latest version of Monitorix directly from dep file.
# Install Monitorix from deb file #
$ wget http://www.monitorix.org/monitorix_3.8.1-izzy1_all.deb
$ sudo dpkg -i monitorix_3.8.1-izzy1_all.deb

# Start, Restart & Enable For SysVinit systems #
$ sudo service monitorx start
$ sudo chkconfig monitorix on
$ sudo service apache2 restart

# Start, Enable For Systemd systems #
$ sudo systemctl start monitorx.service
$ sudo systemctl enable monitorx.service
$ sudo systemctl restart apache2.service
3) Access monitorix Web
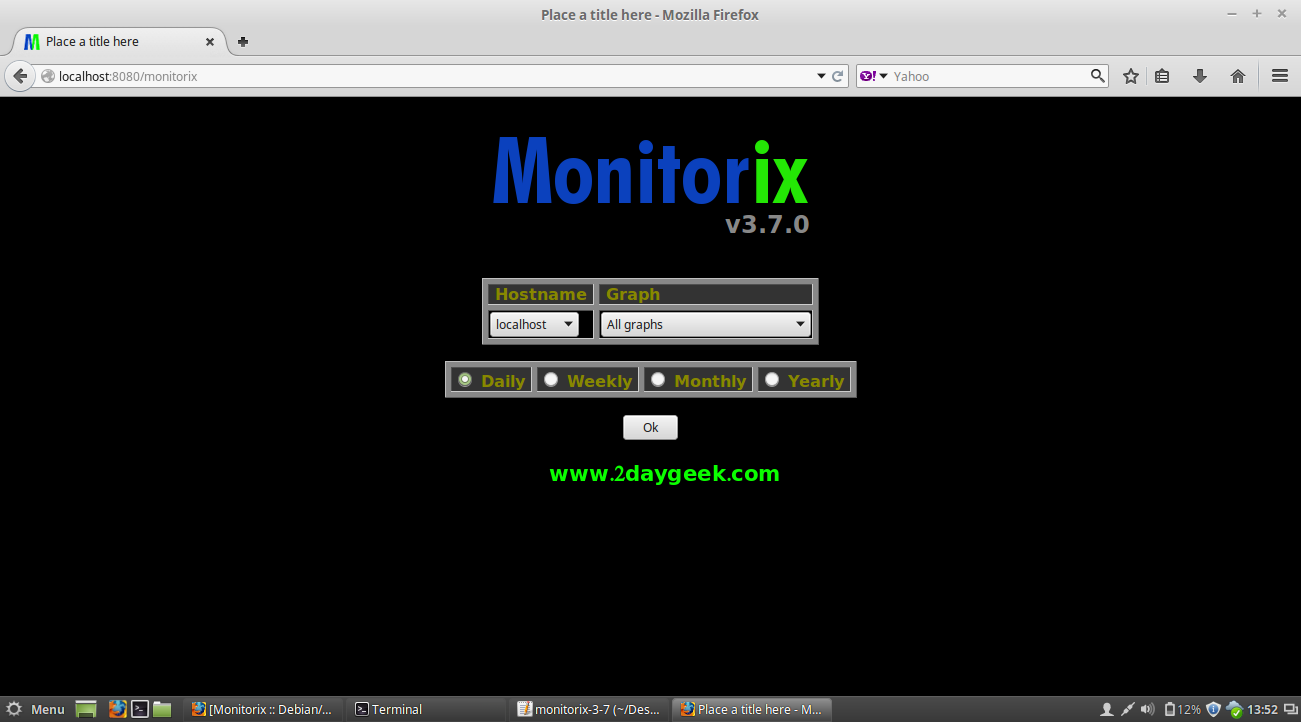
Navigate your browser to http://localhost:8080/monitorix or http://IP-Address:8080/monitorix and choose the Graph and hit ok to view the graph. See the below screen shot for monitorix Home page.

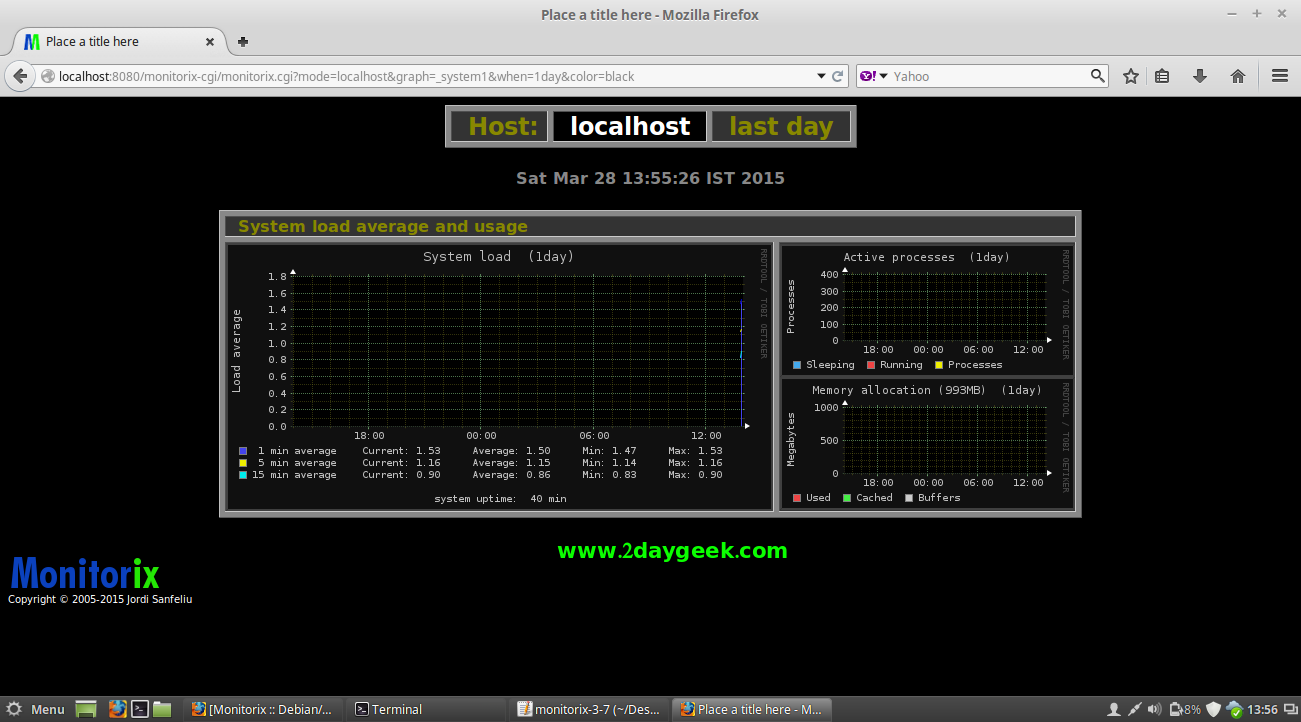
Here i’m going to choose system load as average, active process & memory allocation grap.

Its, lightweight system monitoring tool and very handy to work on it. try at your end then give your valuable feedback.


Gracias.
@Cueti,
Welcome.
@Cueti,
Welcome.
@Cueti,
Welcome.