As we already know about Bandwidth because we all are in smartphone world and using 3G & 4G, and fiber optic-based Internet for home use. We don’t know how its gone (I mean bandwidth usage/utilization) and any leakage happened.
Bandwidth leakage will result a slow response from running application over the network. So carefully monitor bandwidth spikes to avoid the unnecessary leakage. bmon stands for Bandwidth monitoring tool which used to monitor and debug networking related issues. It capture real-time bandwidth usage and supports various input methods for different architectures.
It features various output methods like HTML output, ASCII output, graph, interactive curses user interface and a programmable text output for scripting.
bmon shows the traffic usage over all the network interfaces on the system.
Install bmon in Linux
Most of the distributions (Debian, Ubuntu, Mint, Fedora, suse, openSUSE, Arch Linux, Manjaro, Mageia, etc.) has the bmon package so, we can easily install it from distribution official repository.
For Debian based systems, use apt-get or apt package manager to install bmon.
$ sudo apt install bmon
For Fedora system, use dnf package manager to install bmon.
$ sudo dnf install bmon
For openSUSE system, use zypper package manager to install bmon.
$ sudo zypper in bmon
For Arch Linux based systems, use pacman package manager to install bmon.
$ pacman -S bmon
For CentOS system there is no official package for bmon, so we need to install manually. Follow the below procedure to install bmon on CentOS6/RHEL6.
$ git clone https://github.com/tgraf/bmon.git && cd bmon
$ sudo yum install make libconfuse-devel libnl3-devel libnl-route3-devel ncurses-devel
$ ./autogen.sh
$ ./configure
$ make
$ sudo make install
$ bmon
Follow the source installation method for CentOS7 and other distirubtion which doesn’t offer official package.
Install libconfuse
$ wget https://github.com/martinh/libconfuse/releases/download/v2.8/confuse-2.8.zip
$ unzip confuse-2.8.zip && cd confuse-2.8
$ sudo PATH=/usr/local/opt/gettext/bin:$PATH ./configure
$ make
$ sudo make install
Install bmon
$ git clone https://github.com/tgraf/bmon.git && cd bmon
$ ./autogen.sh
$ ./configure
$ make
$ sudo make install
$ bmon
Monitor live bandwidth usage
After successfully bmon installed with help of above command. Just fire the below command on terminal to monitor bandwidth usage.
# bmon
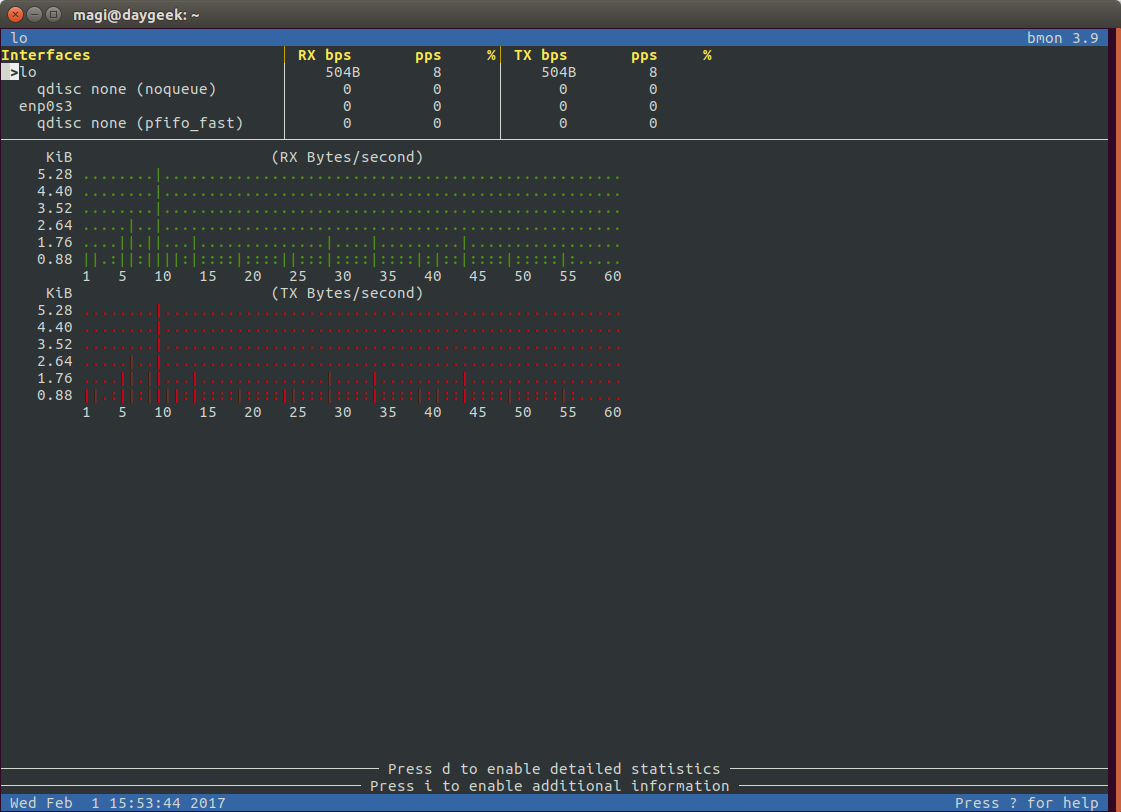
By default bmon shows only interface info, if you want to load graphics, hit g, i and d for detailed information. These widgets are standard one and not possible to rearrange it.
 lo                                                                                                                                    bmon 3.9
Interfaces                     │ RX bps       pps     %│ TX bps       pps     %
 >lo                           │   1.44KiB     24      │   1.44KiB     24
    qdisc none (noqueue)       │      0         0      │      0         0
  enp0s3                       │    156B        2      │    152B        1
    qdisc none (pfifo_fast)    │      0         0      │    148B        1
───────────────────────────────┴───────────────────────┴────────────────────────────────────────────────────────────────────────────────────────
     KiB                      (RX Bytes/second)                              KiB                      (TX Bytes/second)
    6.09 .........................|..................................       6.09 .........................|..................................
    5.08 .........................||.................................       5.08 .........................||.................................
    4.06 ..................|......||....................|............       4.06 ..................|......||....................|............
    3.05 .....|.|..........|......||....................||.|....|....       3.05 .....|.|..........|......||....................||.|....|....
    2.03 |.|..|.|..|......||......||....................||.|....|....       2.03 |.|..|.|..|......||......||....................||.|....|....
    1.02 |||::||||:|::::||||:|::::|||::|::::|::::|::::||||:|::|:|:::|       1.02 |||::||||:|::::||||:|::::|||::|::::|::::|::::||||:|::|:|:::|
         1   5   10   15   20   25   30   35   40   45   50   55   60            1   5   10   15   20   25   30   35   40   45   50   55   60


───────────────────────────────────────┬───────────────────────────────────────┬────────────────────────────────────────────────────────────────
                      RX          TX   │                      RX          TX   │                      RX          TX
 Bytes             15.51MiB    15.51MiB│ Packets          258.25K     258.25K  │ Abort Error           -           0
 Carrier Error         -           0   │ Collisions            -           0   │ Compressed            0           0
 CRC Error             0           -   │ Dropped               0           0   │ Errors                0           0
 FIFO Error            0           0   │ Frame Error           0           -   │ Heartbeat Erro        -           0
 ICMPv6                0           0   │ ICMPv6 Checksu        0           -   │ ICMPv6 Errors         0           0
 Ip6 Address Er        0           -   │ Ip6 Broadcast         0           0   │ Ip6 Broadcast         0           0
 Ip6 CE Packets        0           -   │ Ip6 Checksum E        0           -   │ Ip6 Delivers     124.83K          -
 Ip6 ECT(0) Pac        8           -   │ Ip6 ECT(1) Pac        0           -   │ Ip6 Forwarded         -           0
 Ip6 Header Err        0           -   │ Ip6 Multicast         0           0   │ Ip6 Multicast         0           0
 Ip6 No Route          0           0   │ Ip6 Non-ECT Pa   124.85K          -   │ Ip6 Reasm/Frag        0           0
 Ip6 Reasm/Frag        0           0   │ Ip6 Reasm/Frag        0           0   │ Ip6 Reassembly        0           -
 Ip6 Too Big Er        0           -   │ Ip6 Truncated         0           -   │ Ip6 Unknown Pr        0           -
 Ip6Discards           0           0   │ Ip6Octets          8.34MiB     8.33MiB│ Ip6Pkts          124.86K     124.83K
 Length Error          0           -   │ Missed Error          0           -   │ Multicast             -           0
 Over Error            0           -   │ Window Error          -           0   │
───────────────────────────────────────┼───────────────────────────────────────┼────────────────────────────────────────────────────────────────
 MTU                             65536 │ Flags          loopback,up,running,lo │ Operstate                     unknown
 IfIndex                             1 │ Address             00:00:00:00:00:00 │ Broadcast           00:00:00:00:00:00
 Mode                          default │ TXQlen                              1 │ Family                         unspec
 Alias                                 │ Qdisc                         noqueue │
 Fri Jan 27 18:35:43 2017                                                                                                      Press ? for help
Bmon output is divided into four parts.
- Part-1 : Display the available interfaces, received & transferred bytes.
- Part-2 : Display the same output alike above with graphical statistics.
- Part-3 : Display the detailed information about received & transferred bytes.
- Part-4 : Display the additional information.
Navigate to Quick Reference page by hitting ? button for easy to use bmon.
                              ┌───────────────QUICK REFERENCE────────────────┐
                              │ Navigation                                   │
                              │   Up, Down      Previous/Next element        │
                              │   PgUp, PgDown  Scroll up/down entire page   │
                              │   Left, Right   Previous/Next attribute      │
                              │   [, ]          Previous/Next group          │
                              │   ?             Toggle quick reference       │
                              │   q             Quit bmon                    │
                              │                                              │
                              │ Display Settings                             │
                              │   d             Toggle detailed statistics   │
                              │   l             Toggle element list          │
                              │   i             Toggle additional info       │
                              │                                              │
                              │ Graph Settings                               │
                              │   g             Toggle graphical statistics  │
                              │   H             Start recording history data │
                              │   TAB           Switch time unit of graph    │
                              │   <, >          Change number of graphs      │
			      │   r             Reset counter of element     │
			      └──────────────────────────────────────────────┘
Display specific interface usage
If you want to display specific interface activity for better monitoring. Add -p option, followed by Interface Name with bmon.
# bmon -p eth0

 enp0s3                                                                                             bmon 3.9
Interfaces                     │ RX bps       pps     %│ TX bps       pps     %
 >enp0s3                       │     11B        0      │     11B        0
───────────────────────────────┴───────────────────────┴─────────────────────────────────────────────────────
       B                      (RX Bytes/second)
  618.00 ...........|................................................
  515.00 ...........|................................................
  412.00 ...........|................................................
  309.00 ...........|................................................
  206.00 ........|..|................................................
  103.00 .|......|..|................................................
         1   5   10   15   20   25   30   35   40   45   50   55   60
       B                      (TX Bytes/second)
  160.00 ........|...................................................
  133.33 ........|...................................................
  106.67 ........|...................................................
   80.00 ........|...................................................
   53.33 .|......|..|................................................
   26.67 .|......|..|................................................
         1   5   10   15   20   25   30   35   40   45   50   55   60


─────────────────────────────────── Press d to enable detailed statistics ───────────────────────────────────
───────────────────────────────── Press i to enable additional information ──────────────────────────────────
 Fri Jan 27 18:42:39 2017                                                                   Press ? for help
Set Read Interval
By default bmon show statistics every 1 seconds. We can change the statistics read interval by adding -r option, followed by
seconds with bmon.
# bmon -r 5
get ascii output
By default bmon show statistics output in curses mode. If you want to get the output in ascii mode, add -o option, followed by ascii with bmon.
# bmon -o ascii

Interfaces                               RX bps         pps      %    TX bps         pps      %
  lo                                          0           0                0           0
   qdisc none (noqueue)                       0           0                0           0
  enp0s3                                      0           0                0           0
   qdisc none (pfifo_fast)                    0           0                0           0
Interfaces                               RX bps         pps      %    TX bps         pps      %
  lo                                        239B          3              239B          3
   qdisc none (noqueue)                       0           0                0           0
  enp0s3                                      0           0                0           0
   qdisc none (pfifo_fast)                    0           0                0           0
Interfaces                               RX bps         pps      %    TX bps         pps      %
  lo                                        419B          6              419B          6
   qdisc none (noqueue)                       0           0                0           0
  enp0s3                                     59B          0               59B          0
   qdisc none (pfifo_fast)                    0           0               53B          0
Read more about bmon
If you want to know more option which is available for bmon, simply navigate to man page.
[bmon man page]
# bmon --help
or
# man bmon


Article has been updated with CentOS instruction.
Bad article, This on a RHEL7 install:
[root@xxxroot]# yum install bmon
Loaded plugins: langpacks, product-id, search-disabled-repos, subscription-manager
rhel-7-server-rpms | 3.5 kB 00:00:00
rhel-7-server-rt-beta-rpms | 4.0 kB 00:00:00
rhel-7-server-rt-rpms | 4.0 kB 00:00:00
(1/2): rhel-7-server-rpms/7Server/x86_64/updateinfo | 1.9 MB 00:00:00
(2/2): rhel-7-server-rpms/7Server/x86_64/primary_db | 38 MB 00:00:02
No package bmon available.
Error: Nothing to do