The Linux administrator can’t live even a day without using the Top Command, because whenever a Linux system load is too high, your fingers can automatically type in the terminal TOP command without second thoughts.
Most of us are not familiar with the Htop Command because most of the time we use the top command to keep track of Linux system performance.
But htop is a great alternative to the top command, which has many features and options compared to the top command.
What’s htop
The htop command is an interactive process viewer for Linux/Unix systems. It is a text-mode application and requires the ncurses library, it was developed by Hisham.
It is designed as an alternative to the top command. CPU and memory metrics are shown in the bar charts.
This is similar to the top command, but allows you to scroll vertically and horizontally to see all the processes running the system.
htop comes with Visual Colors, which have added benefits and are very evident when it comes to tracking system performance.
You are free to carry out any tasks related to processes, such as process killing and renicing without entering their PIDs.
How is Htop Better Than the Top Command
- Htop lets you scroll the list vertically and horizontally to view all processes and entire command lines.
- Htop starts faster compared with top command, seems that top collect data for a while before displaying anything.
- The specified process can be killed without inputting the process ID.
- You can renice a process without entering the process ID or priority value.
- You can kill multiple processes at once
- The Htop command comes with a color output
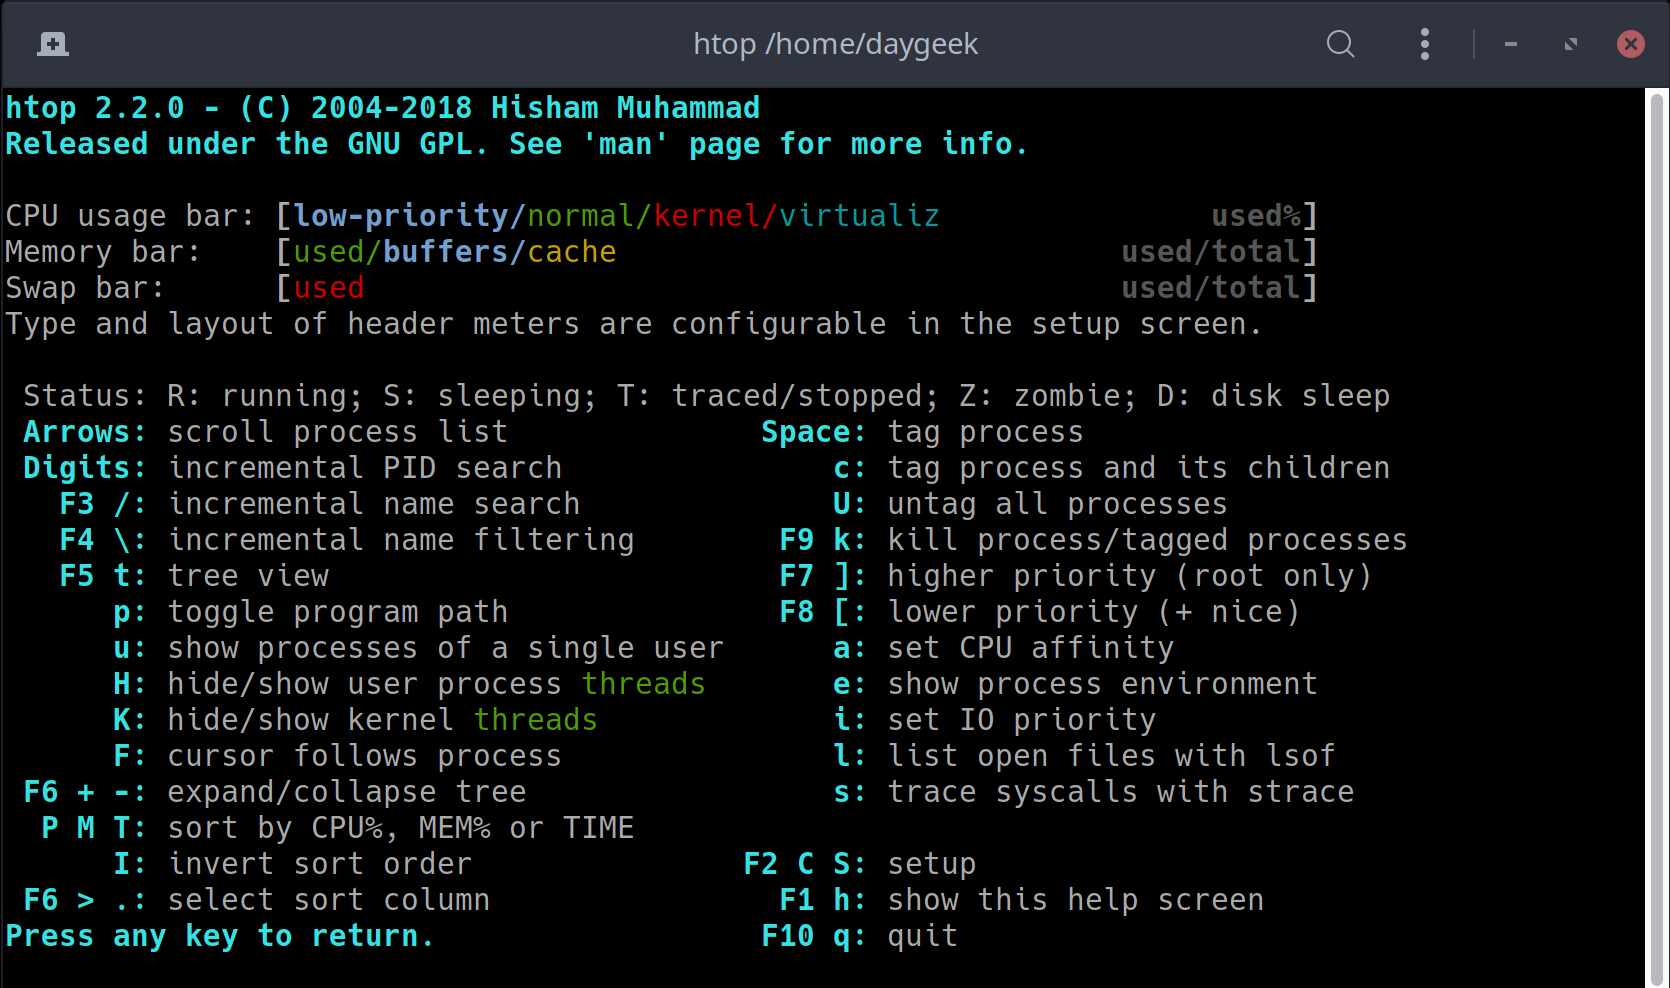
Have you ever wondered why there are so many colors in the progress bar? If you don’t know, here are the details for you.

Below is the color coding of CPU metrics.
- Blue: Display percentage of CPU used by low priority processes.
- Green: Displays percentage of CPU used for processes owned by normal users.
- Red: Displays percentage of CPU used by system processes.
- Cyan: Displays percentage of CPU consumed by Steal time.
Below is the color coding of Memory metrics.
- Green: Displays percentage of RAM used.
- Blue: Displays percentage of buffer used.
- Orange: Displays percentage of cache used.
Below is the color coding of SWAP metric.
- Red: Displays the percentage of SWAP memory used.
1) How to Install the Htop Command on Linux
The htop utility is available in most of the distribution official repository so you can easily install it.
For Fedora system, use DNF Command to install htop.
$ sudo dnf install htop
For Debian/Ubuntu systems, use APT-GET Command or APT Command to install htop.
$ sudo apt install htop
For Arch Linux based systems, use Pacman Command to install htop.
$ sudo pacman -S htop
For RHEL/CentOS systems, use YUM Command to install htop.
Install the EPEL Repository on the RHEL and CentOS system to install the Htop command, because this package is not available in their official repository.
$ sudo yum install htop
For openSUSE Leap system, use Zypper Command to install htop.
$ sudo zypper install htop
2) Understanding the Htop Command Output
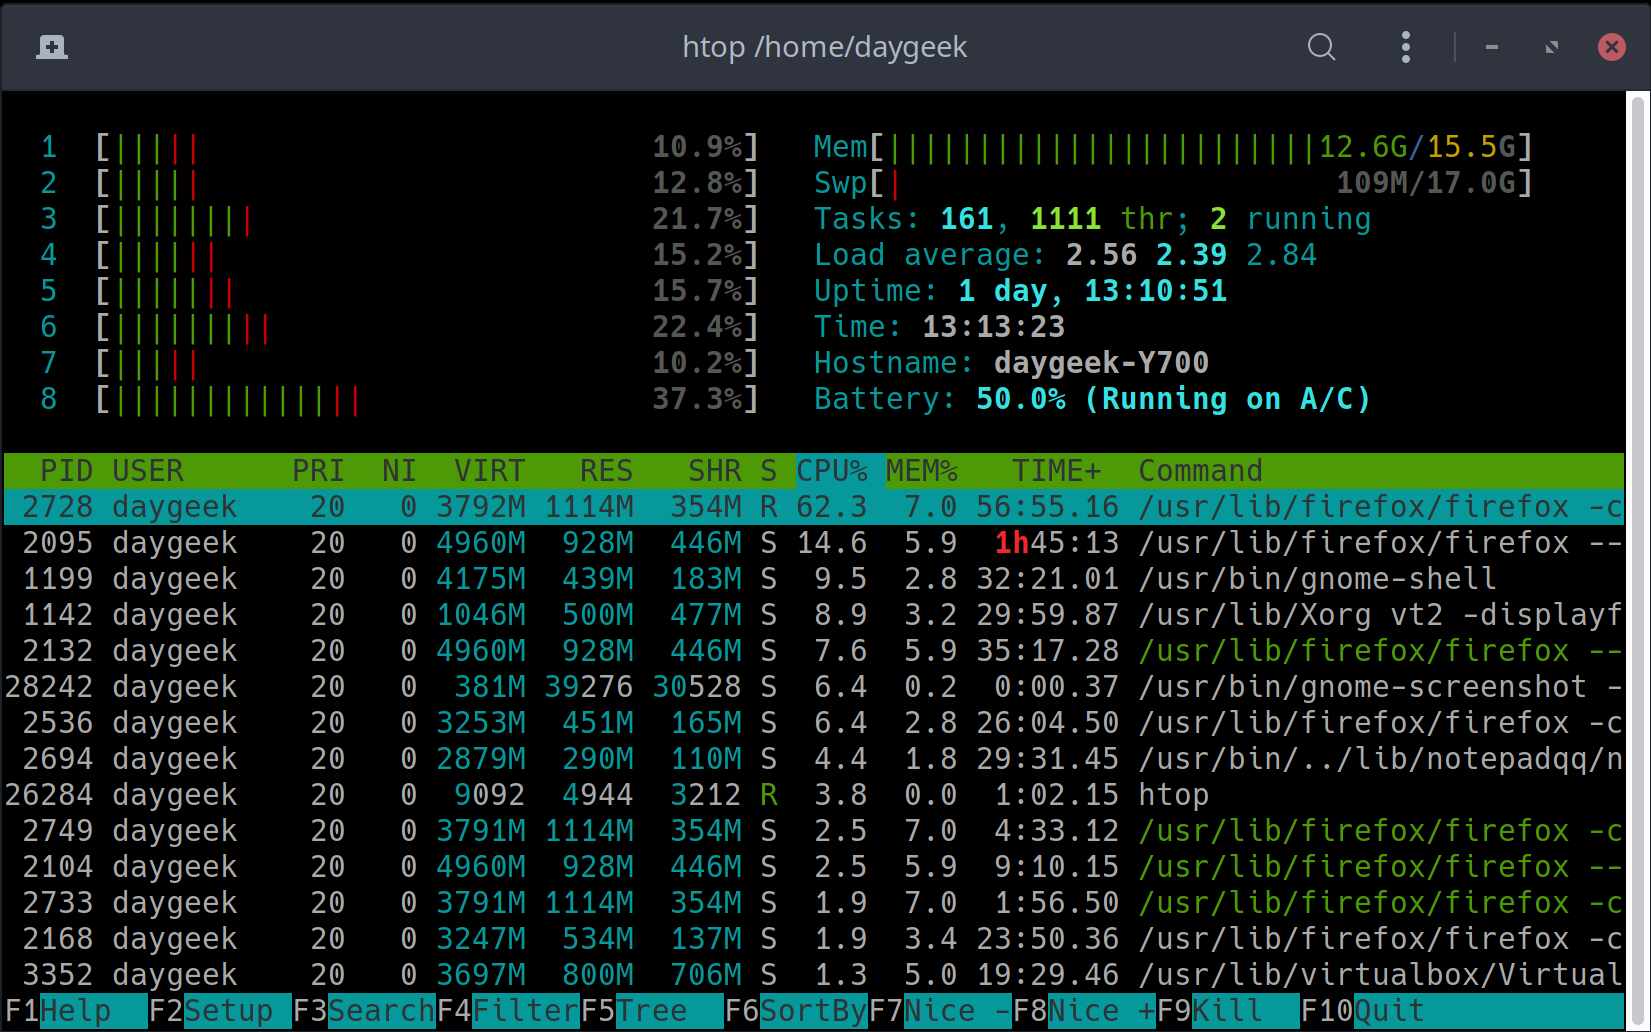
The Htop command output can be considered of three parts (header, body and footer). The details of each part release are described below.
- Header: The header section shows the CPU usage, memory usage, swap usage, load average, and system uptime. This area is highly configurable based on your needs.
- Body: The body displays a list of processes currently running on your system.
- Footer: The footer area has the htop menu option, which allows you to perform various actions immediately.
3) How to Sort the Htop Command Output With Other Fields
By default the Htop command sorts the output through the CPU usage, which is common to all monitoring tools. Press F6 function key if you want to align output with different fields such as memory, BID.
This will bring up a menu on the left side when you press the “F6” function key, select the fields you want to sort using the arrow keys and press the “ENTER” button to sort them.
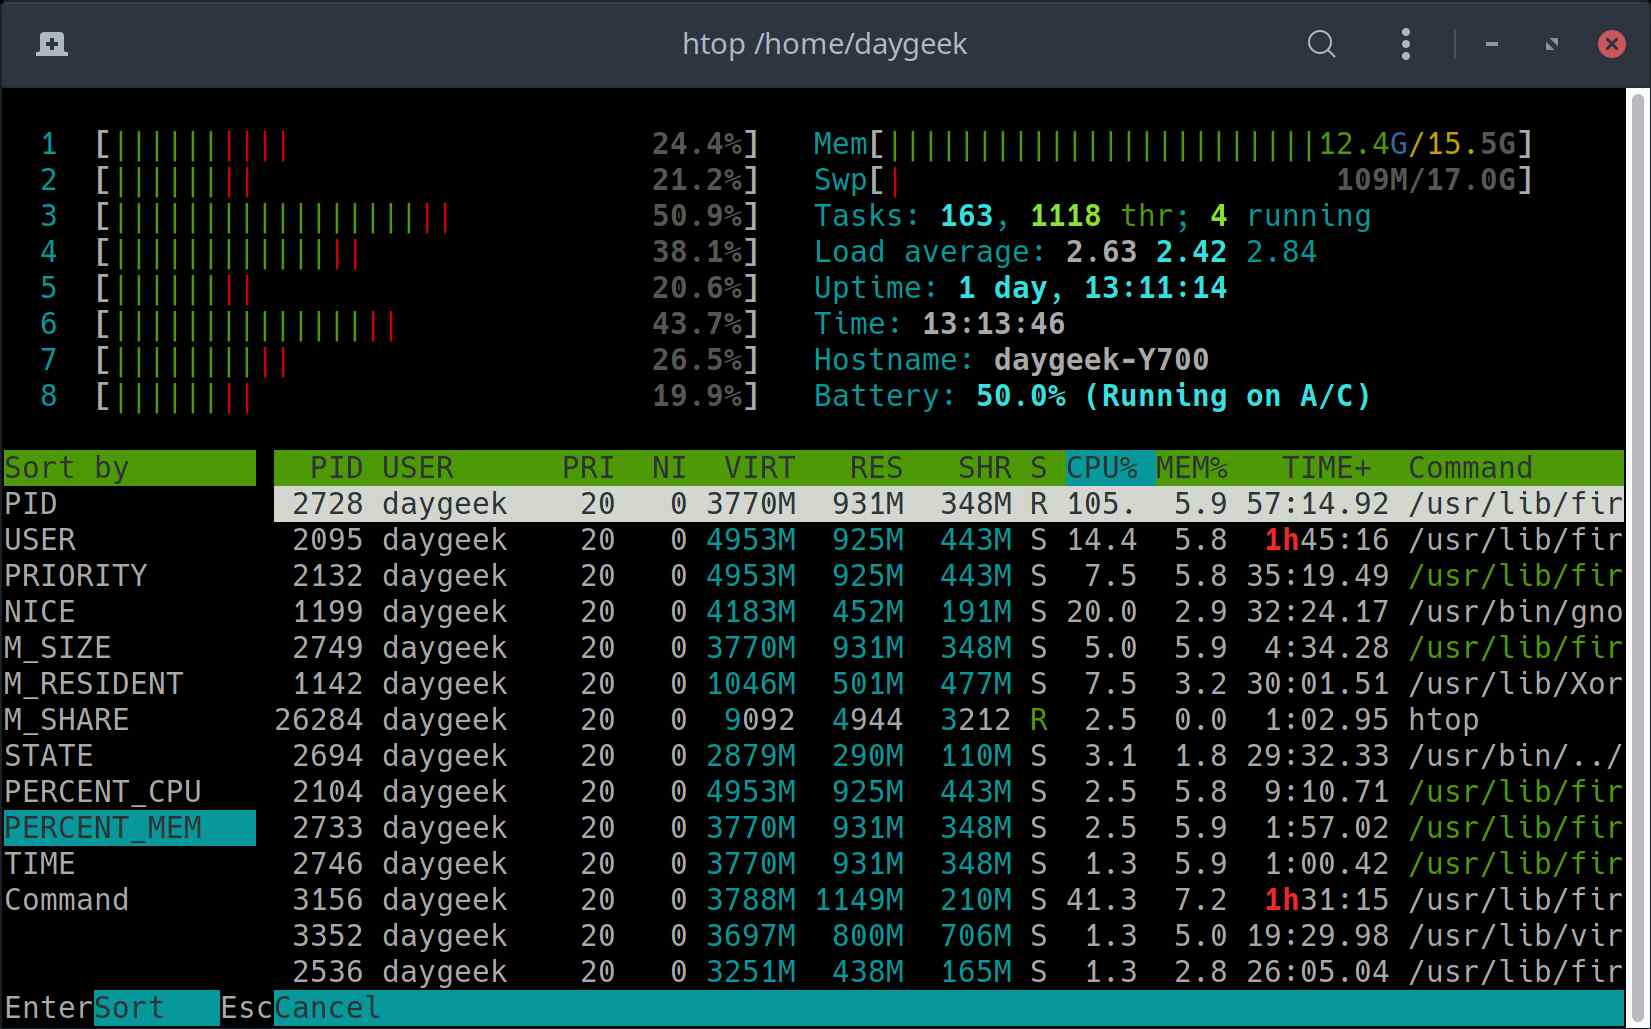
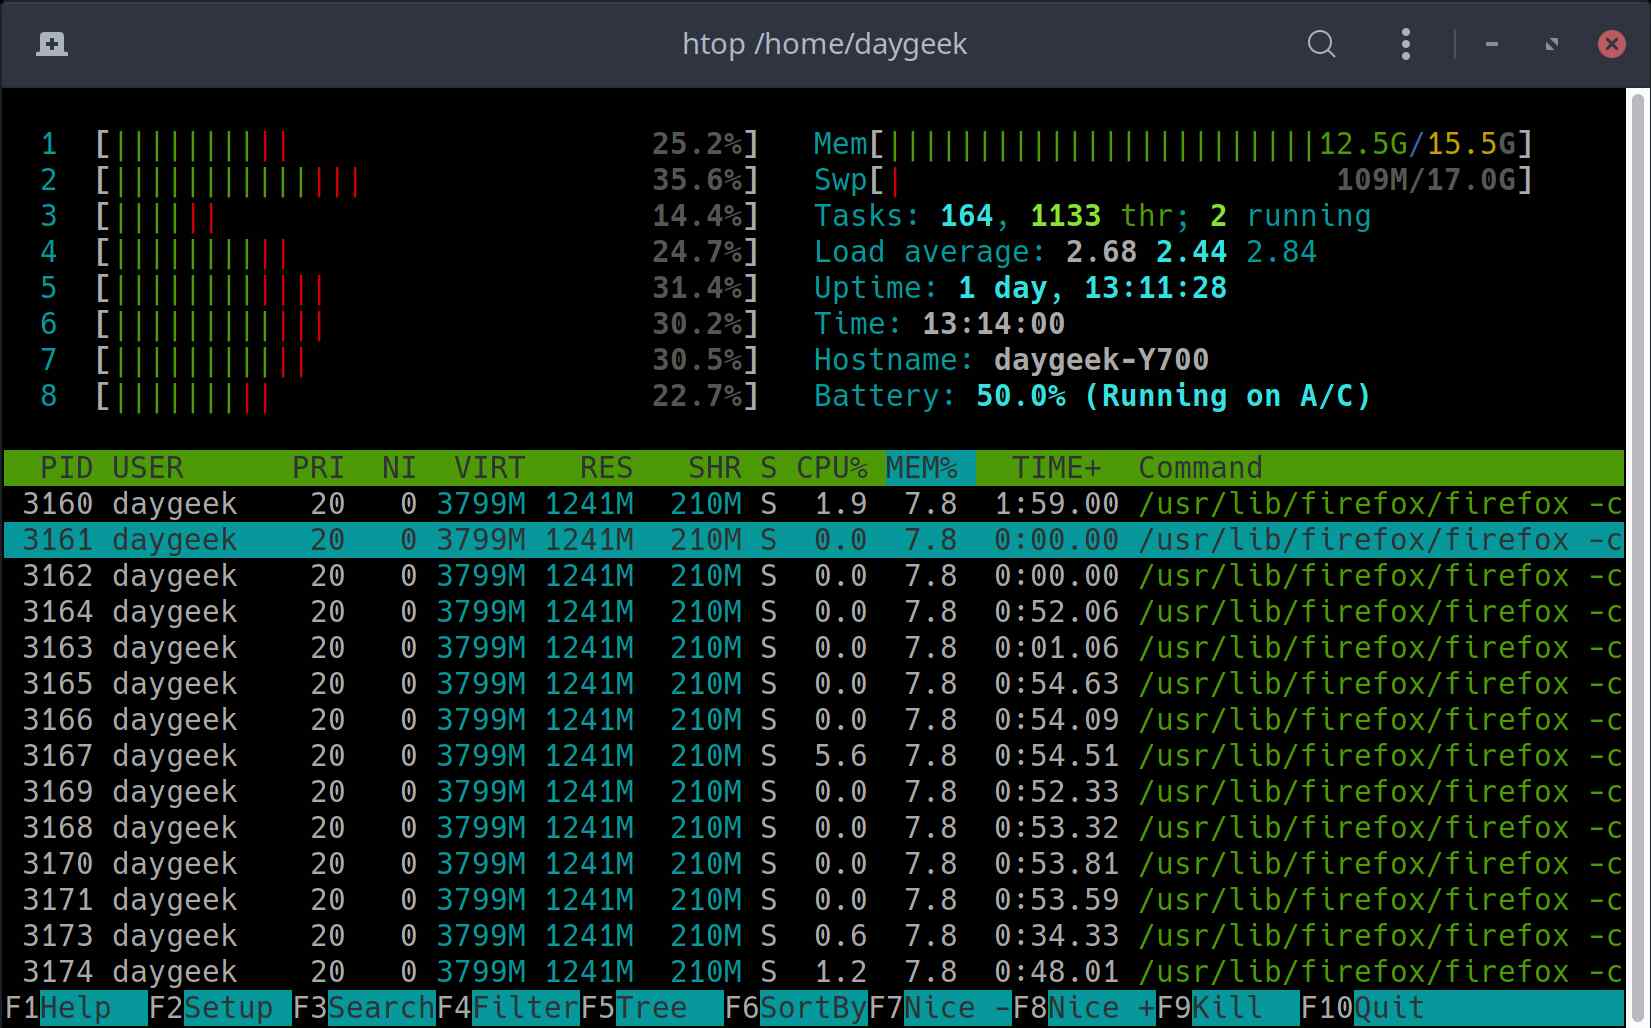
To demonstrate this, we are going to sort the htop command output by memory usage. See the below screen shot.
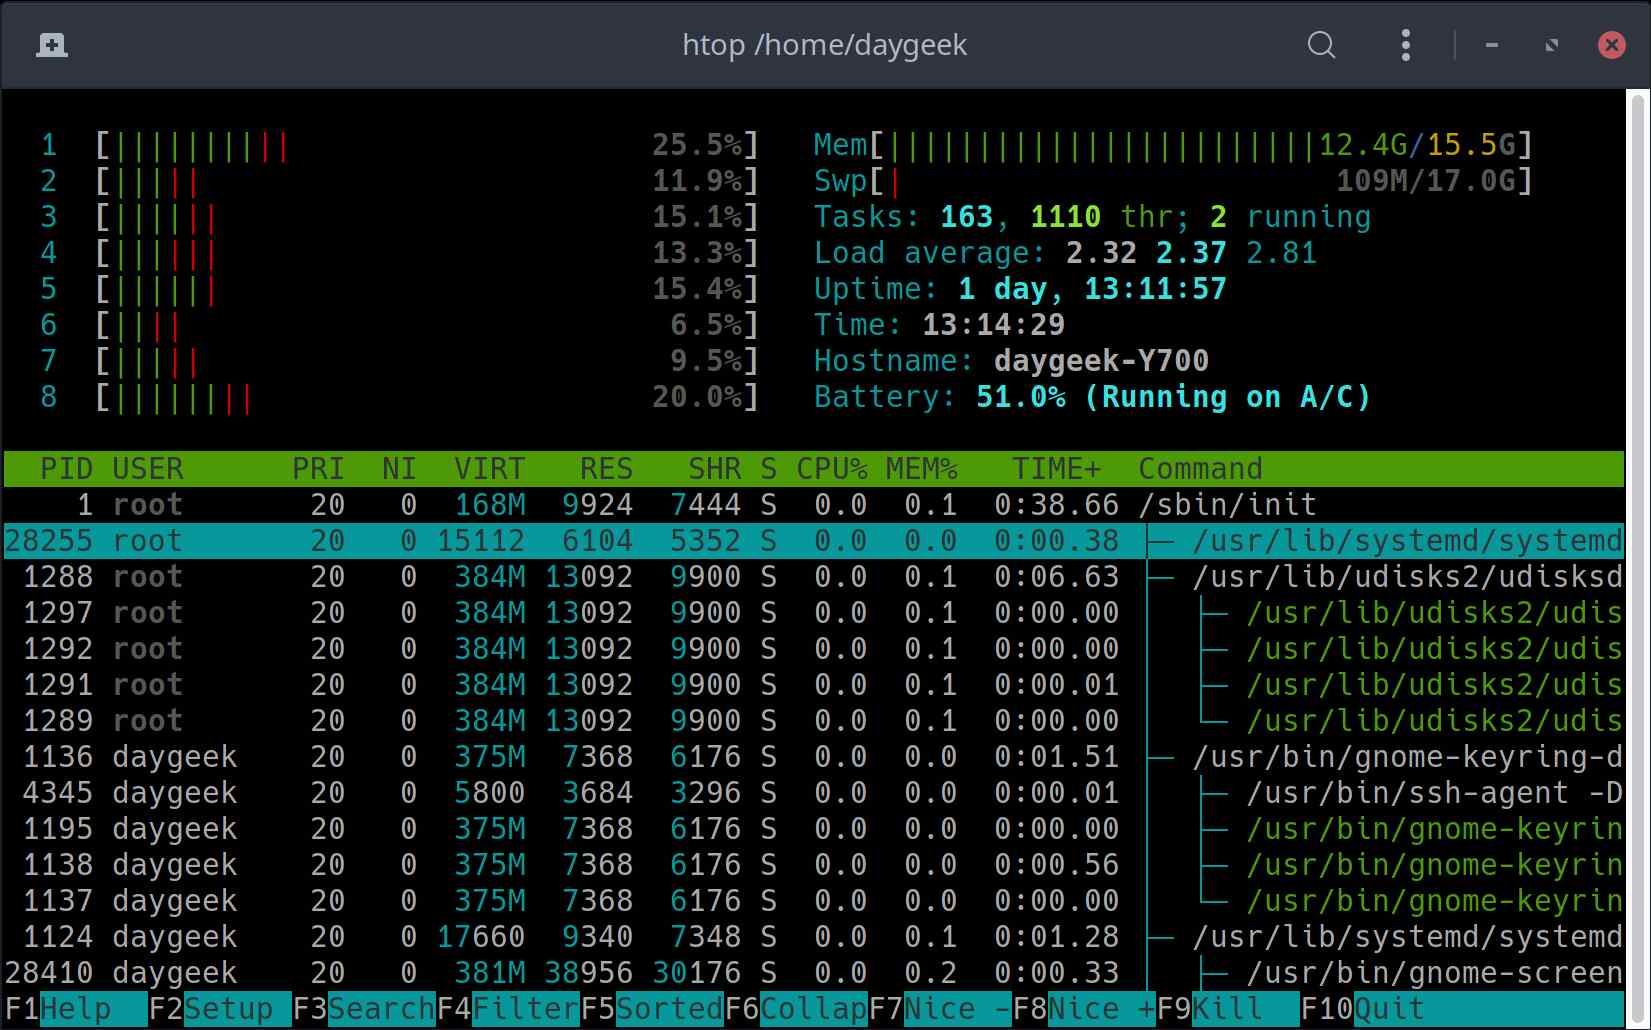
4) How to List Processes in a Tree View
In a default view, you can only view parent processes in the command section. This is not enough to identify the real root causes, just press the F5 function key to see the child-parent relationship.
5) How to Kill a Process in the Htop Command Output
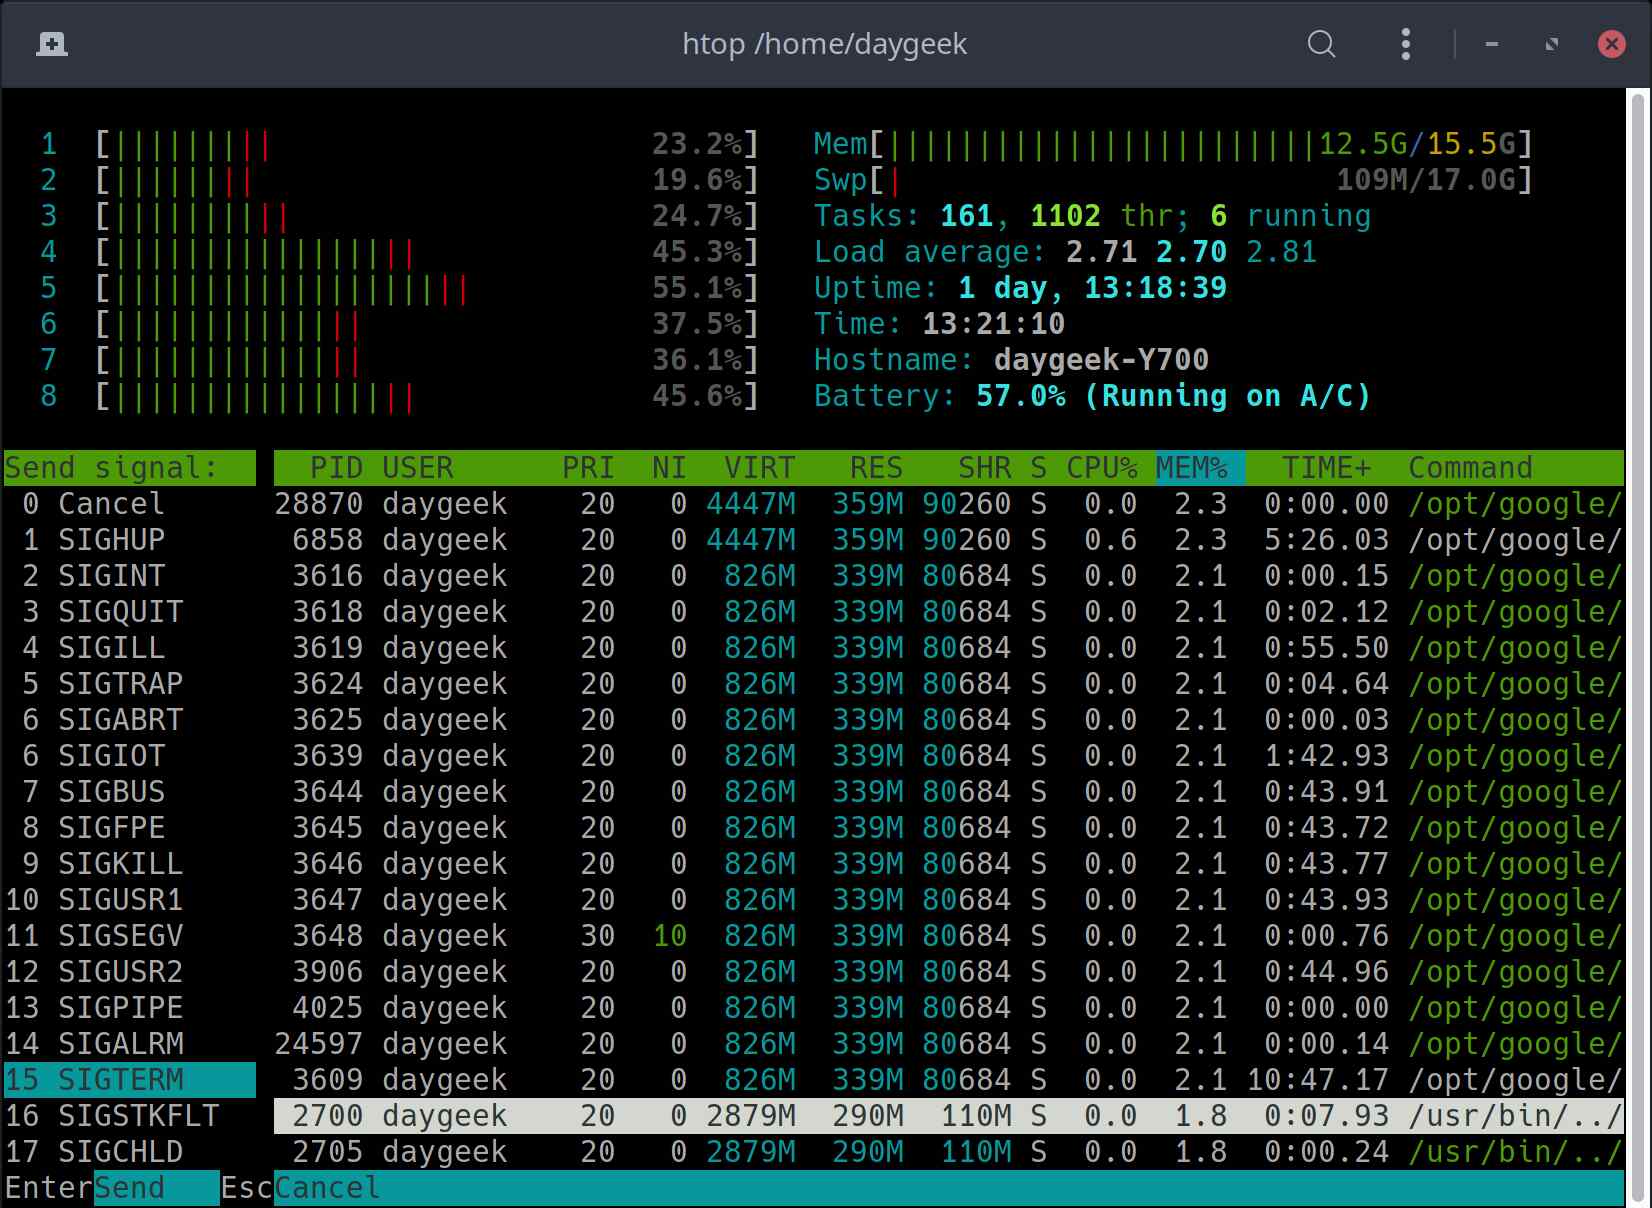
Select the process you want to kill and press the F9 function key and select the signal you want to send and finally press the “ENTER” button to kill it. We’re going to kill the notepad process.
6) How to Find a Process in the Htop Command Output
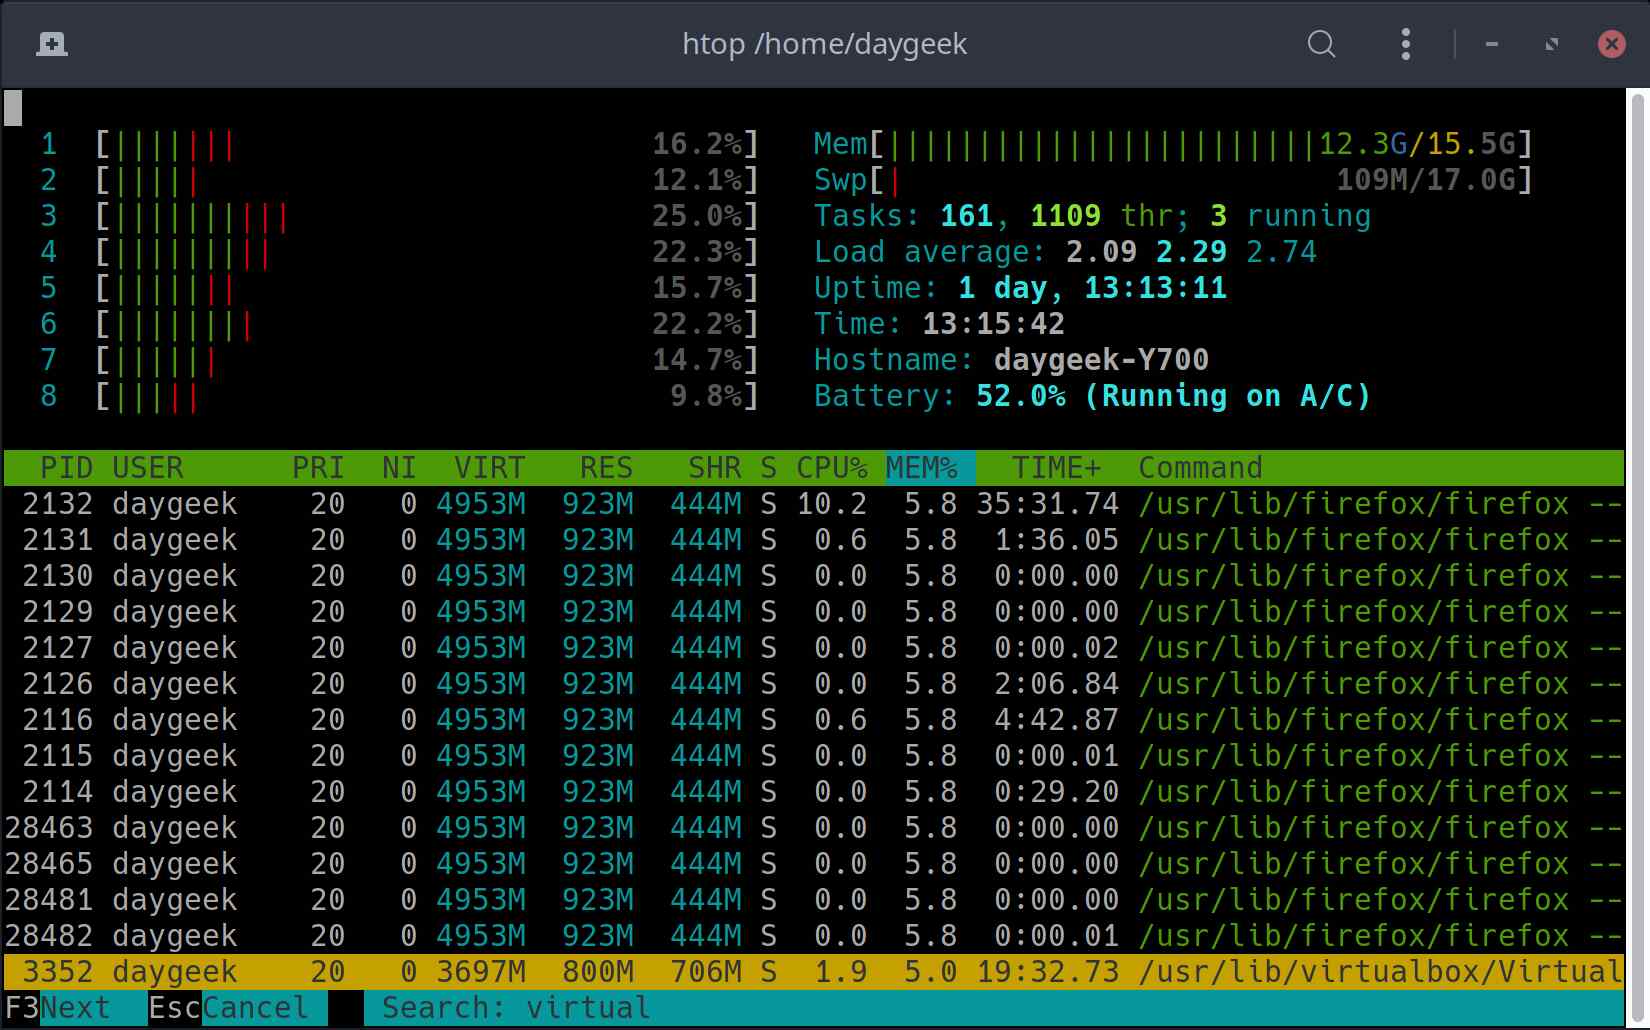
By pressing the F3 function key, you will receive a search prompt at the bottom of the screen where you can enter the search string.
Type the process you want to search for and press the “Enter” button. We are going to search for the “Virtulbox” process, and when set, the process will be highlighted in yellow.
7) How to Customize the Htop Header Output
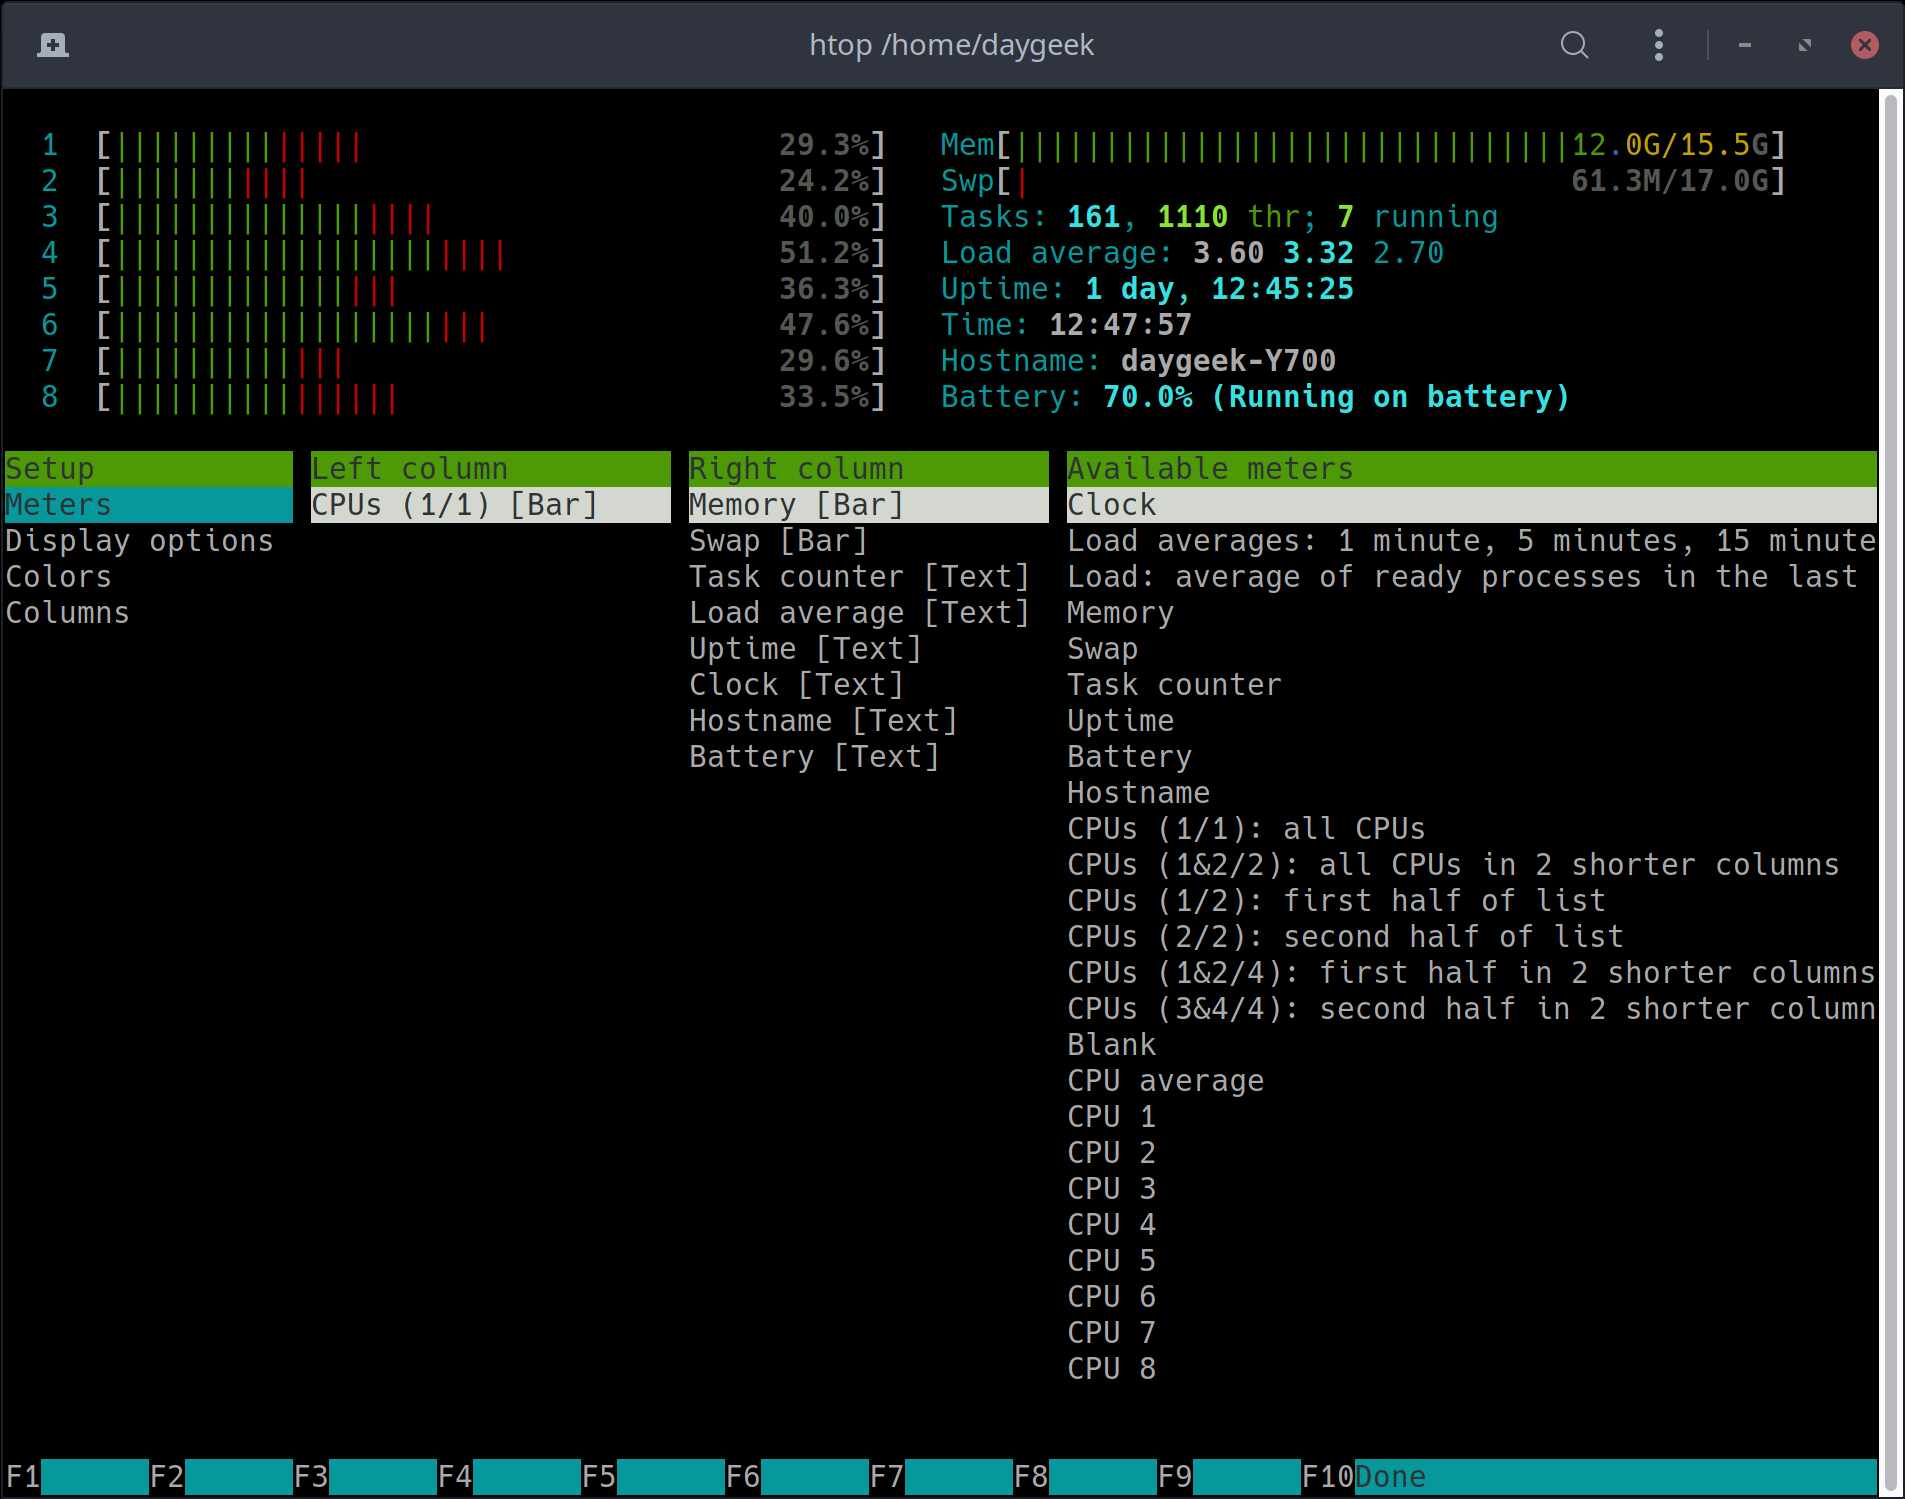
As I said at the beginning of the article, the htop header release is very customizable to suit your needs. To do so, press the F2 function key.
You have permission to change the new meter from the list, change the color, and change the column output.
8) Htop Help
You can launch the htop help page by pressing F1 function key.
