systemd is the default system manager in most of the major Linux distributions, which comes with a new logging daemon called ‘journald’.
For many years, system and kernel logs in traditional SysVinit system were handled by syslogd that stores logs in plain text files whereas journald stores logs in binary format.
systemd collects logs from several sources such as system, kernel and various services or daemon’s and provides a centralized management solution through journald.
This is a highly streamlined process and logs can be viewed based on requirements, whereas syslogd logs are manually analyzed using various commands such as find, grep, cut, etc.
In this article, we will demonstrate how to view and analyze Linux system logs using the journalctl command.
What’s journald?
journald is the daemon from systemd that collects the logs from various sources like system, kernel & services and stores them in a binary format for easy manipulation.
All these logging events are handled by journald daemon, which provides a centralized way of handling the logs regardless of where the messages are originating from.
This gives a number of significant advantages for reading log data according to your needs.
What’s journalctl?
journalctl is a command line tool used for viewing logs which are collected by journald daemon of systemd.
The journal logs are well indexed and structured in a way that allows system administrators to easily analyze and manipulate the logs based on various parameters like, filter the logs based on time, boot sequence, specific service, severity, etc.
1) How to make the Journal log Persistent on your system?
By default, journal logs are enabled in most of the Linux distributions, but it stores log data at ‘/run/log/journal/’, which is erased by default at reboot.
To make them permanent, perform the following steps that will automatically create the directory ‘/var/log/journal/’ for you.
Make a note: The directory ‘/var/log/journal/’ must exist with correct ownership and permissions so the systemd-journald service can store its data.
As a root-user, open the ‘/etc/systemd/journald.conf’ file and uncomment the line containing 'Storage=auto' and change it to 'Storage=persistent'. Alternatively, you can use the sed command to replace the matching string in the file.
$ sudo sed -i '/Storage/ c\Storage=persistent' /etc/systemd/journald.conf
Once you have modified, you can confirm this by running the following command:
$ cat /etc/systemd/journald.conf

[Journal]
Storage=persistent
#Compress=yes
#Seal=yes
#SplitMode=uid
#SyncIntervalSec=5m
#RateLimitIntervalSec=30s
#RateLimitBurst=1000
Restart systemd-journald as shown below:
$ sudo systemctl restart systemd-journald
Change the file permission as shown below:
sudo chown -R root:systemd-journal /var/log/journal
Now, you should be able to view the logs from the following directory:
$ ls -lh /var/log/journal
total 0
drwxr-sr-x 1 root systemd-journal 392 Mar 15 15:56 7a138ee71db94e8785d1a4dbe54dde7e
2) Understanding journalctl useful Switches
Before going into the Journalctl command, you should know the list of frequently used switches, which will make journalctl easier to use. They are listed below:
- -f : Shows only the most recent journal logs and real time journal messages.
- -e : Jump to the end of the journal to show latest events.
- -r : Print the messages of the journal in reverse chronological order
- -k : It shows only kernel messages.
- -u : Show only messages for the specified systemd unit.
- -b : It shows messages from a specific boot and displays current boot messages if specific boot sessions are not included.
- –list-boots : Shows boot sessions in a table, which including their IDs, and the timestamps of the first and last message pertaining to the boot.
- –utc : Express time in Coordinated Universal Time (UTC).
- -p, –priority= : Filter output by message priorities.
- -S, –since= : Filter logs based on start time
- -U, –until= : Filter logs based on end time
- –disk-usage : Shows the current disk usage of all journal files.
3) How to use journalctl to read logs
You can filter the journal logs based on your need with help of various parameters & fields. We will show you how to use them.
3.a) Basic log viewing with journalctl command
When you run journalctl command without switches, it shows the full contents of the journal, with the oldest entries listed first.
It uses ‘less’ command in the back-end to show you the logs. Hence, you can use the same keys to move around the logs that you use with the ‘less’ command.
$ sudo journalctl
The default view of journal logs can be easily read by humans, but if you need more verbose output, run:
$ sudo journalctl -o verbose
3.b) Showing logs in reverse order
As you noticed, the above output shown logs in chronological order. To display recent logs first, run the journalctl command with the '-r' option.
$ sudo journalctl -r

-- Logs begin at Sat 2021-03-13 15:51:12 IST, end at Thu 2021-03-18 01:56:20 IST. --
Mar 18 01:56:20 2daygeek sudo[23711]: pam_unix(sudo:session): session opened for user root by (uid=1000)
Mar 18 01:56:20 2daygeek sudo[23711]: linuxgeek : TTY=pts/0 ; PWD=/home/linuxgeek ; USER=root ; COMMAND=/usr/bin/journalctl -r
Mar 18 01:56:20 2daygeek sudo[23711]: gkr-pam: unable to locate daemon control file
Mar 18 01:55:11 2daygeek systemd[1]: Started Network Manager Script Dispatcher Service.
Mar 18 01:55:11 2daygeek dbus-daemon[1190]: [system] Successfully activated service 'org.freedesktop.nm_dispatcher'
Mar 18 01:55:11 2daygeek systemd[1]: Starting Network Manager Script Dispatcher Service…
Mar 18 01:55:11 2daygeek NetworkManager[1487]:   [1616012711.5640] dhcp4 (wlan0): state changed bound -> extended
Mar 18 01:55:11 2daygeek NetworkManager[1487]:   [1616012711.5639] dhcp4 (wlan0): option subnet_mask          => '255.255.255.0'
Mar 18 01:55:11 2daygeek NetworkManager[1487]:   [1616012711.5639] dhcp4 (wlan0): option routers              => '192.168.1.1'
....
3.c) Displaying only ‘N’ recent lines
You can display only a certain number of recent lines from the journal log using the '-n' option instead of the entire log, as shown below:
$ sudo journalctl -n 20

-- Logs begin at Sat 2021-03-13 15:51:12 IST, end at Thu 2021-03-18 01:58:22 IST. --
Mar 18 01:55:11 2daygeek NetworkManager[1487]:   [1616012711.5638] dhcp4 (wlan0): option requested_ntp_servers => '1'
Mar 18 01:55:11 2daygeek NetworkManager[1487]:   [1616012711.5638] dhcp4 (wlan0): option requested_rfc3442_classless_static_routes => '1'
Mar 18 01:55:11 2daygeek NetworkManager[1487]:   [1616012711.5638] dhcp4 (wlan0): option requested_root_path  => '1'
Mar 18 01:55:11 2daygeek NetworkManager[1487]:   [1616012711.5638] dhcp4 (wlan0): option requested_routers    => '1'
Mar 18 01:55:11 2daygeek NetworkManager[1487]:   [1616012711.5638] dhcp4 (wlan0): option requested_static_routes => '1'
Mar 18 01:55:11 2daygeek NetworkManager[1487]:   [1616012711.5639] dhcp4 (wlan0): option requested_subnet_mask => '1'
Mar 18 01:55:11 2daygeek NetworkManager[1487]:   [1616012711.5639] dhcp4 (wlan0): option requested_time_offset => '1'
Mar 18 01:55:11 2daygeek NetworkManager[1487]:   [1616012711.5639] dhcp4 (wlan0): option requested_wpad       => '1'
Mar 18 01:55:11 2daygeek NetworkManager[1487]:   [1616012711.5639] dhcp4 (wlan0): option routers              => '192.168.1.1'
Mar 18 01:55:11 2daygeek NetworkManager[1487]:   [1616012711.5639] dhcp4 (wlan0): option subnet_mask          => '255.255.255.0'
....
3.d) Checking real time journal logs
Real time logs can be viewed with '-f' option using the ‘journalctl’ command as shown below. This can be useful when troubleshooting some issue.
$ sudo journalctl -f
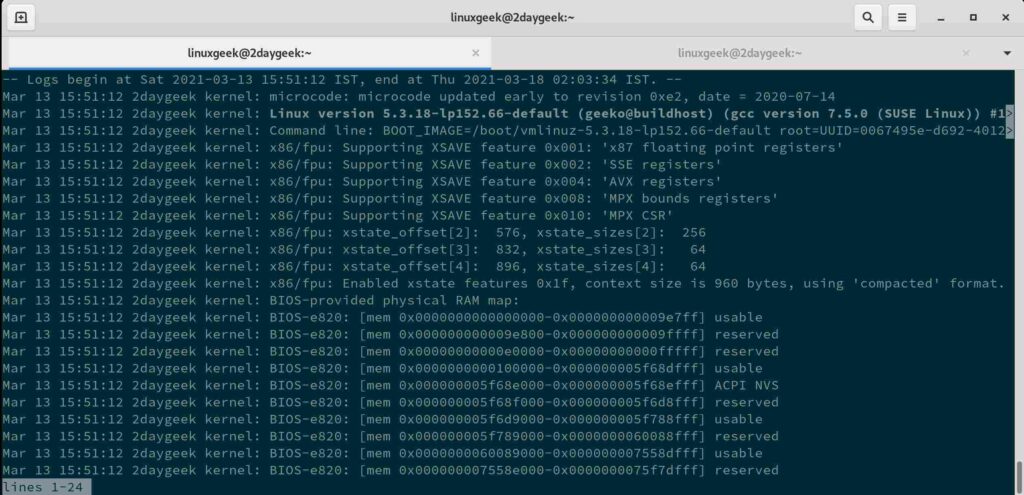
3.e) Show only kernel logs
Filter can be applied based on your need. To display only kernel logs, use '-k' option with journalctl command. This is equivalent to the field match ‘_TRANSPORT=kernel’.
$ sudo journalctl -k
or
$ sudo journalctl _TRANSPORT=kernel

-- Logs begin at Sat 2021-03-13 15:51:12 IST, end at Thu 2021-03-18 01:59:04 IST. --
Mar 17 13:54:17 2daygeek kernel: microcode: microcode updated early to revision 0xe2, date = 2020-07-14
Mar 17 13:54:17 2daygeek kernel: Linux version 5.3.18-lp152.66-default (geeko@buildhost) (gcc version 7.5.0 (SUSE Linux)) #1 SMP Tue Mar 2 13:18>
Mar 17 13:54:17 2daygeek kernel: Command line: BOOT_IMAGE=/boot/vmlinuz-5.3.18-lp152.66-default root=UUID=0067495e-d692-4012-92ab-1f456f7308d8 s>
Mar 17 13:54:17 2daygeek kernel: x86/fpu: Supporting XSAVE feature 0x001: 'x87 floating point registers'
Mar 17 13:54:17 2daygeek kernel: x86/fpu: Supporting XSAVE feature 0x002: 'SSE registers'
Mar 17 13:54:17 2daygeek kernel: x86/fpu: Supporting XSAVE feature 0x004: 'AVX registers'
Mar 17 13:54:17 2daygeek kernel: x86/fpu: Supporting XSAVE feature 0x008: 'MPX bounds registers'
Mar 17 13:54:17 2daygeek kernel: x86/fpu: Supporting XSAVE feature 0x010: 'MPX CSR'
....
3.f) Filtering a particular boot session log
Every time you boot your system, a new boot entry is created in the journal. To list all the available boots, run the below command:
$ sudo journalctl --list-boots

-2 69e010680e3b41cdb6a2d1a189e1055b Sat 2021-03-13 15:51:12 IST—Tue 2021-03-16 14:57:33 IST
-1 cff6f21577e046139579c031cdbf5845 Tue 2021-03-16 21:25:15 IST—Wed 2021-03-17 01:45:55 IST
 0 3287f2347f3d4c71920e415a38509a13 Wed 2021-03-17 13:54:17 IST—Thu 2021-03-18 01:59:38 IST
Journal boot logs are prefixed by a number, which starts from zero. '0' is referring to the current boot. Boot session '-1' is the last booted session and so on. To view messages from a particular boot, run the below command.
Let’s show all messages from the current boot:
$ sudo journalctl -b

-- Logs begin at Sat 2021-03-13 15:51:12 IST, end at Thu 2021-03-18 02:00:12 IST. --
Mar 17 13:54:17 2daygeek kernel: microcode: microcode updated early to revision 0xe2, date = 2020-07-14
Mar 17 13:54:17 2daygeek kernel: Linux version 5.3.18-lp152.66-default (geeko@buildhost) (gcc version 7.5.0 (SUSE Linux)) #1 SMP Tue Mar 2 13:18>
Mar 17 13:54:17 2daygeek kernel: Command line: BOOT_IMAGE=/boot/vmlinuz-5.3.18-lp152.66-default root=UUID=0067495e-d692-4012-92ab-1f456f7308d8 s>
Mar 17 13:54:17 2daygeek kernel: x86/fpu: Supporting XSAVE feature 0x001: 'x87 floating point registers'
Mar 17 13:54:17 2daygeek kernel: x86/fpu: Supporting XSAVE feature 0x002: 'SSE registers'
Mar 17 13:54:17 2daygeek kernel: x86/fpu: Supporting XSAVE feature 0x004: 'AVX registers'
To check output of the previous boot session messages, run the below command:
$ sudo journalctl -b -1
3.g) Filtering based on Time Interval
Journal logs can be filtered based on a time interval. Multiple arguments can be used with time filter as shown below. To use time filter, use the '-S or --since' and '-U or --until' command line switches.
To filter logs since yesterday, run the below command:
$ sudo journalctl -S yesterday
To filter only today’s logs, run the below command (we can use either 'today' or '00:00' and both are same):
$ sudo journalctl -S today
or
$ sudo journalctl -S 00:00
To filter logs only for yesterday, run the below command:
$ sudo journalctl --since yesterday --until 00:00
To filter logs since March 12, run the below command:
$ sudo journalctl -S 2021-03-12
To filter logs with date and time, run the below command.
Note that “Date and Time” uses the following format, 'year-month-day' & 'hour:minute:second'.
$ sudo journalctl --since "2021-03-11 20:10:00" --until "2021-03-15"
To filter messages from the last hour, use the below command:
$ sudo journalctl -S -1h
3.h) Filtering by Priority
Filtering can be applied to message priority, which can be useful when you want to filter a specific message like “warning” or “error”, etc.
The below table lists all the priority levels:
| Priority | Code |
|---|---|
| 0 | emerg |
| 1 | alert |
| 2 | crit |
| 3 | err |
| 4 | warning |
| 5 | notice |
| 6 | info |
| 7 | debug |
$ sudo journalctl -p 3 -b
or
$ sudo journalctl -p err -b

-- Logs begin at Sat 2021-03-13 15:51:12 IST, end at Thu 2021-03-18 02:02:25 IST. --
Mar 17 13:54:17 2daygeek kernel: platform MSFT0101:00: failed to claim resource 1: [mem 0xfed40000-0xfed40fff]
Mar 17 13:54:17 2daygeek kernel: acpi MSFT0101:00: platform device creation failed: -16
Mar 17 13:54:19 2daygeek kernel: nouveau 0000:01:00.0: bus: MMIO read of 00000000 FAULT at 022554 [ IBUS ]
....
4) Filtering Based on Fields
Journal logs can be filtered by specific fields. The syntax of a field to be matched is ‘FIELD_NAME=MATCHED_VALUE’, such as ‘SYSTEMD_UNIT=httpd.service’. Also, you can specify multiple matches in a single query to filter the output messages in more convenient way.
4.a) Filter by Unit
To show messages produced by a specified service, use the commands give below. Similarly, you can filter any service messages. To check available service logs, type “journalctl -u “ and then press TAB two times.
$ sudo journalctl -u httpd.service
or
$ sudo journalctl _SYSTEMD_UNIT=httpd.service
4.b) Filtering logs based on UID, GID and PID
To show messages produced by a specific process ID, run the below command:
$ sudo journalctl _PID=1039
To show messages produced by a specific user ID, run the below command:
$ sudo journalctl _UID=1021
To show messages produced by a specific group ID, run the below command:
$ sudo journalctl _GID=1050
Filter can be applied for more than one field at a time, but it will show only entries that match both expressions:
$ sudo journalctl _SYSTEMD_UNIT=httpd.service _PID=1500
Logical expressions can be used with ‘journalctl’ command as shown below. The following example shows all messages from the Apache service process and all messages from the MySQL service:
$ sudo journalctl _SYSTEMD_UNIT=httpd-daemon.service + _SYSTEMD_UNIT=mysqld.service
4.c) Filter by File Path
Filter can be applied based on the running process’ file path as shown below:
$ sudo journalctl /usr/bin/gnome-shell
4.e) Filter by Device Path
To filter a message related to a specific device, run the below command::
$ sudo journalctl /dev/sda

-- Logs begin at Sat 2021-03-13 15:51:12 IST, end at Thu 2021-03-18 02:10:09 IST. --
Mar 17 13:54:17 2daygeek kernel: pci 0000:00:17.0: [8086:a103] type 00 class 0x010601
Mar 17 13:54:17 2daygeek kernel: pci 0000:00:17.0: reg 0x10: [mem 0x94428000-0x94429fff]
Mar 17 13:54:17 2daygeek kernel: pci 0000:00:17.0: reg 0x14: [mem 0x9442d000-0x9442d0ff]
Mar 17 13:54:17 2daygeek kernel: ahci 0000:00:17.0: version 3.0
Mar 17 13:54:17 2daygeek kernel: scsi 2:0:0:0: Direct-Access     ATA      WDC WD10SPCX-24H 1A02 PQ: 0 ANSI: 5
Mar 17 13:54:17 2daygeek kernel: sd 2:0:0:0: [sda] 1953525168 512-byte logical blocks: (1.00 TB/932 GiB)
....
5) Checking disk usage of all journal files
When you enable persistent storage for journal log, it uses up to ‘10%’ of the file system the ‘/var/log/journal’ resides on.
To see how much storage space the journal files are using, run the below command:
$ sudo journalctl --disk-usage

Archived and active journals take up 40.0M in the file system.
Closing Notes
In this tutorial, we’ve shown you what is journal and how to use journalctl command to filter journal logs based on various parameters.
If you found this article helpful, please do share with your friends and spread the knowledge. Please feel free to comment below if you have any queries/concerns. We will get back to you as soon as we can. Happy learning!


Hi,
Thanks a lot