Most of the system administrators checks CPU & Memory utilization when they were facing some performance issue.
There is lot of utilities are available in Linux to check physical memory.These commands are help us to check the physical RAM present in system, also allow users to check memory utilization in varies aspect.
Most of us know only few commands and we are trying to include all the possible commands in this article.You may think, why I want to know all these commands instead of knowing some of the specific and routine commands.
Don’t think bad or don’t take in negative way because each one has different requirement and perception so, who’s looking for other purpose then this will very helpful for them.
What is RAM
Computer memory is a physical device which capable to store information temporarily or permanently. RAM stands for Random Access Memory is a volatile memory that stores information used by the operating system, software, and hardware.
Two types of memory is available.
- Primary Memory
- Secondary Memory
Primary memory is the main memory of the computer. CPU can directly read or write on this memory. It is fixed on the motherboard of the computer.
RAM:Random Access Memory is a temporary memory. This information will go away when the computer is turned off.ROM:Read Only Memory is permanent memory, that holds the data even if the system is switched off.
Method-1 : Using free Command
free displays the total amount of free and used physical and swap memory in the system, as well as the buffers and caches used by the kernel. The information is gathered by parsing /proc/meminfo.
Suggested Read : free – A Standard Command to Check Memory Usage Statistics (Free & Used) in Linux
$ free -m
              total        used        free      shared  buff/cache   available
Mem:           1993        1681          82          81         228         153
Swap:         12689        1213       11475

$ free -g
              total        used        free      shared  buff/cache   available
Mem:              1           1           0           0           0           0
Swap:            12           1          11
Method-2 : Using /proc/meminfo file
/proc/meminfo is a virtual text file that contains a large amount of valuable information about the systems RAM usage.
It reports the amount of free and used memory (both physical and swap) on the system.
$ grep MemTotal /proc/meminfo
MemTotal:        2041396 kB

$ grep MemTotal /proc/meminfo | awk '{print $2 / 1024}'
1993.55

$ grep MemTotal /proc/meminfo | awk '{print $2 / 1024 / 1024}'
1.94683
Method-3 : Using top Command
Top command is one of the basic command to monitor real-time system processes in Linux. It display system information and running processes information like uptime, average load, tasks running, number of users logged in, number of CPUs & cpu utilization, Memory & swap information. Run top command then hit E to bring the memory utilization in MB.
Suggested Read : TOP Command Examples to Monitor Server Performance
$ top

top - 14:38:36 up  1:59,  1 user,  load average: 1.83, 1.60, 1.52
Tasks: 223 total,   2 running, 221 sleeping,   0 stopped,   0 zombie
%Cpu(s): 48.6 us, 11.2 sy,  0.0 ni, 39.3 id,  0.3 wa,  0.0 hi,  0.5 si,  0.0 st
MiB Mem : 1993.551 total,   94.184 free, 1647.367 used,  252.000 buff/cache
MiB Swap: 12689.58+total, 11196.83+free, 1492.750 used.  306.465 avail Mem

  PID USER      PR  NI    VIRT    RES    SHR S  %CPU %MEM     TIME+ COMMAND
 9908 daygeek   20   0 2971440 649324  39700 S  55.8 31.8  11:45.74 Web Content
21942 daygeek   20   0 2013760 308700  69272 S  35.0 15.1   4:13.75 Web Content
 4782 daygeek   20   0 3687116 227336  39156 R  14.5 11.1  16:47.45 gnome-shell
Method-4 : Using vmstat Command
vmstat is a standard nifty tool that report virtual memory statistics of Linux system. vmstat reports information about processes, memory, paging, block IO, traps, and cpu activity. It helps Linux administrator to identify system bottlenecks while troubleshooting the issues.
Suggested Read : vmstat – A Standard Nifty Tool to Report Virtual Memory Statistics
$ vmstat -s | grep "total memory"
      2041396 K total memory

$ vmstat -s -S M | egrep -ie 'total memory'
         1993 M total memory

$ vmstat -s | awk '{print $1 / 1024 / 1024}' | head -1
1.94683
Method-5 : Using nmon Command
nmon is a another nifty tool to monitor various system resources such as CPU, memory, network, disks, file systems, NFS, top processes, Power micro-partition and resources (Linux version & processors) on Linux terminal.
Just press m key to see memory utilization stats (cached, active, inactive, buffered, free in MB & free percent)
Suggested Read : nmon – A Nifty Tool To Monitor System Resources On Linux
┌nmon─14g──────[H for help]───Hostname=2daygeek──Refresh= 2secs ───07:24.44─────────────────┐
│ Memory Stats ─────────────────────────────────────────────────────────────────────────────│
│                RAM     High      Low     Swap    Page Size=4 KB                           │
│ Total MB     32079.5     -0.0     -0.0  20479.0                                           │
│ Free  MB     11205.0     -0.0     -0.0  20479.0                                           │
│ Free Percent    34.9%   100.0%   100.0%   100.0%                                          │
│             MB                  MB                  MB                                    │
│                      Cached= 19763.4     Active=  9617.7                                  │
│ Buffers=   172.5 Swapcached=     0.0  Inactive = 10339.6                                  │
│ Dirty  =     0.0 Writeback =     0.0  Mapped   =    11.0                                  │
│ Slab   =   636.6 Commit_AS =   118.2 PageTables=     3.5                                  │
│───────────────────────────────────────────────────────────────────────────────────────────│
│                                                                                           │
│                                                                                           │
│                                                                                           │
│                                                                                           │
│                                                                                           │
│                                                                                           │
└───────────────────────────────────────────────────────────────────────────────────────────┘
Method-6 : Using dmidecode Command
Dmidecode is a tool which reads a computer’s DMI (stands for Desktop Management Interface)
(some say SMBIOS – stands for System Management BIOS) table contents and display system hardware information in a human-readable format.
This table contains a description of the system’s hardware components, as well as other useful information such as serial number, Manufacturer information, Release Date, and BIOS revision, etc,.
Suggested Read :
Dmidecode – Easy Way To Get Linux System Hardware Information
# dmidecode -t memory | grep  Size:
        Size: 8192 MB
        Size: No Module Installed
        Size: No Module Installed
        Size: 8192 MB
        Size: No Module Installed
        Size: No Module Installed
        Size: No Module Installed
        Size: No Module Installed
        Size: No Module Installed
        Size: No Module Installed
        Size: No Module Installed
        Size: No Module Installed
        Size: 8192 MB
        Size: No Module Installed
        Size: No Module Installed
        Size: 8192 MB
        Size: No Module Installed
        Size: No Module Installed
        Size: No Module Installed
        Size: No Module Installed
        Size: No Module Installed
        Size: No Module Installed
        Size: No Module Installed
        Size: No Module Installed
Print only installed RAM modules.
# dmidecode -t memory | grep  Size: | grep -v "No Module Installed"
        Size: 8192 MB
        Size: 8192 MB
        Size: 8192 MB
        Size: 8192 MB
Sum all the installed RAM modules.
# dmidecode -t memory | grep  Size: | grep -v "No Module Installed" | awk '{sum+=$2}END{print sum}'
32768
Method-7 : Using hwinfo Command
hwinfo stands for hardware information tool is another great utility that used to probe for the hardware present in the system and display detailed information about varies hardware components in human readable format.
It reports information about CPU, RAM, keyboard, mouse, graphics card, sound, storage, network interface, disk, partition, bios, and bridge, etc,.
Suggested Read : hwinfo (Hardware Info) – A Nifty Tool To Detect System Hardware Information On Linux
$ hwinfo --memory
01: None 00.0: 10102 Main Memory
  [Created at memory.74]
  Unique ID: rdCR.CxwsZFjVASF
  Hardware Class: memory
  Model: "Main Memory"
  Memory Range: 0x00000000-0x7a4abfff (rw)
  Memory Size: 1 GB + 896 MB
  Config Status: cfg=new, avail=yes, need=no, active=unknown
Method-8 : Using lshw Command
lshw (stands for Hardware Lister) is a small nifty tool that generates detailed reports about various hardware components on the machine such as memory configuration, firmware version, mainboard configuration, CPU version and speed, cache configuration, usb, network card, graphics cards, multimedia, printers, bus speed, etc.
It’s generating hardware information by reading varies files under /proc directory and DMI table.
Suggested Read : LSHW (Hardware Lister) – A Nifty Tool To Get A Hardware Information On Linux
$ sudo lshw -short -class memory
[sudo] password for daygeek:
H/W path      Device       Class       Description
==================================================
/0/0                       memory      128KiB BIOS
/0/1                       memory      1993MiB System memory
Method-9 : Using inxi Command
inxi is a nifty tool to check hardware information on Linux and offers wide range of option to get all the hardware information on Linux system that i never found in any other utility which are available in Linux. It was forked from the ancient and mindbendingly perverse yet ingenius infobash, by locsmif.
inxi is a script that quickly shows system hardware, CPU, drivers, Xorg, Desktop, Kernel, GCC version(s), Processes, RAM usage, and a wide variety of other useful information, also used for forum technical support & debugging tool.
Suggested Read : inxi – A Great Tool to Check Hardware Information on Linux
$ inxi -F | grep "Memory"
Info:      Processes: 234 Uptime: 3:10 Memory: 1497.3/1993.6MB Client: Shell (bash) inxi: 2.3.37
Method-10 : Using screenfetch Command
screenFetch is a bash script. It will auto-detect your distribution and display an ASCII art version of that distribution’s logo and some valuable information to the right.
Suggested Read : ScreenFetch – Display Linux System Information On Terminal With Distribution ASCII Art Logo
$ screenfetch
                          ./+o+-       daygeek@ubuntu
                  yyyyy- -yyyyyy+      OS: Ubuntu 17.10 artful
               ://+//////-yyyyyyo      Kernel: x86_64 Linux 4.13.0-37-generic
           .++ .:/++++++/-.+sss/`      Uptime: 44m
         .:++o:  /++++++++/:--:/-      Packages: 1831
        o:+o+:++.`..```.-/oo+++++/     Shell: bash 4.4.12
       .:+o:+o/.          `+sssoo+/    Resolution: 1920x955
  .++/+:+oo+o:`             /sssooo.   DE: GNOME
 /+++//+:`oo+o               /::--:.   WM: GNOME Shell
 \+/+o+++`o++o               ++////.   WM Theme: Adwaita
  .++.o+++oo+:`             /dddhhh.   GTK Theme: Azure [GTK2/3]
       .+.o+oo:.          `oddhhhh+    Icon Theme: Papirus-Dark
        \+.++o+o``-````.:ohdhhhhh+     Font: Ubuntu 11
         `:o+++ `ohhhhhhhhyo++os:      CPU: Intel Core i7-6700HQ @ 2x 2.592GHz
           .o:`.syhhhhhhh/.oo++o`      GPU: llvmpipe (LLVM 5.0, 256 bits)
               /osyyyyyyo++ooo+++/     RAM: 1521MiB / 1993MiB
                   ````` +oo+++o\:
                          `oo++.
Method-11 : Using neofetch Command
Neofetch is a cross-platform and easy-to-use command line (CLI) script that collects your Linux system information and display it on the terminal next to an image, either your distributions logo or any ascii art of your choice.
Suggested Read : Neofetch – Shows Linux System Information With ASCII Distribution Logo
$ neofetch
            .-/+oossssoo+/-.               daygeek@ubuntu
        `:+ssssssssssssssssss+:`           --------------
      -+ssssssssssssssssssyyssss+-         OS: Ubuntu 17.10 x86_64
    .ossssssssssssssssssdMMMNysssso.       Host: VirtualBox 1.2
   /ssssssssssshdmmNNmmyNMMMMhssssss/      Kernel: 4.13.0-37-generic
  +ssssssssshmydMMMMMMMNddddyssssssss+     Uptime: 47 mins
 /sssssssshNMMMyhhyyyyhmNMMMNhssssssss/    Packages: 1832
.ssssssssdMMMNhsssssssssshNMMMdssssssss.   Shell: bash 4.4.12
+sssshhhyNMMNyssssssssssssyNMMMysssssss+   Resolution: 1920x955
ossyNMMMNyMMhsssssssssssssshmmmhssssssso   DE: ubuntu:GNOME
ossyNMMMNyMMhsssssssssssssshmmmhssssssso   WM: GNOME Shell
+sssshhhyNMMNyssssssssssssyNMMMysssssss+   WM Theme: Adwaita
.ssssssssdMMMNhsssssssssshNMMMdssssssss.   Theme: Azure [GTK3]
 /sssssssshNMMMyhhyyyyhdNMMMNhssssssss/    Icons: Papirus-Dark [GTK3]
  +sssssssssdmydMMMMMMMMddddyssssssss+     Terminal: gnome-terminal
   /ssssssssssshdmNNNNmyNMMMMhssssss/      CPU: Intel i7-6700HQ (2) @ 2.591GHz
    .ossssssssssssssssssdMMMNysssso.       GPU: VirtualBox Graphics Adapter
      -+sssssssssssssssssyyyssss+-         Memory: 1620MiB / 1993MiB
        `:+ssssssssssssssssss+:`
            .-/+oossssoo+/-.
Method-12 : Using dmesg Command
dmesg (stands for display message or driver message) is a command on most Unix-like operating systems that prints the message buffer of the kernel.
$ dmesg | grep "Memory"
[    0.000000] Memory: 1985916K/2096696K available (12300K kernel code, 2482K rwdata, 4000K rodata, 2372K init, 2368K bss, 110780K reserved, 0K cma-reserved)
[    0.012044] x86/mm: Memory block size: 128MB
Method-13 : Using atop Command
Atop is an ASCII full-screen system performance monitoring tool for Linux that is capable of reporting the activity of all server processes (even if processes have finished during the interval).
It’s logging of system and process activity for long-term analysis (By default, the log files are preserved for 28 days), highlighting overloaded system resources by using colors, etc. It shows network activity per process/thread with combination of the optional kernel module netatop.
Suggested Read : Atop – Monitor real time system performance, resources, process & check resource utilization history
$ atop -m

ATOP - ubuntu                                                   2018/03/31  19:34:08                                                   -------------                                                    10s elapsed
PRC | sys    0.47s  | user   2.75s  |               |              |  #proc    219 |  #trun      1 | #tslpi   802  | #tslpu     0  | #zombie    0  | clones     7 |               |               |  #exit      4 |
CPU | sys       7%  | user     22%  | irq       0%  |              |               |  idle    170% | wait      0%  |               | steal     0%  | guest     0% |               |  curf 2.59GHz |  curscal   ?% |
cpu | sys       3%  | user     11%  | irq       0%  |              |               |  idle     85% | cpu001 w  0%  |               | steal     0%  | guest     0% |               |  curf 2.59GHz |  curscal   ?% |
cpu | sys       4%  | user     11%  | irq       0%  |              |               |  idle     85% | cpu000 w  0%  |               | steal     0%  | guest     0% |               |  curf 2.59GHz |  curscal   ?% |
CPL | avg1    1.98  |               | avg5    3.56  | avg15   3.20 |               |               | csw    14894  |               | intr    6610  |              |               |  numcpu     2 |               |
MEM | tot     1.9G  | free  101.7M  | cache 244.2M  | dirty   0.2M |  buff    6.9M |  slab   92.9M | slrec  35.6M  | shmem  97.8M  | shrss  21.0M  | shswp   3.2M |  vmbal   0.0M |  hptot   0.0M |  hpuse   0.0M |
SWP | tot    12.4G  | free   11.6G  |               |              |               |               |               |               |               |              |  vmcom   7.9G |               |  vmlim  13.4G |
PAG | scan       0  | steal      0  |               | stall      0 |               |               |               |               |               |              |  swin       3 |               |  swout      0 |
DSK |          sda  | busy      0%  |               | read     114 |  write     37 |  KiB/r     21 | KiB/w      6  |               | MBr/s    0.2  | MBw/s    0.0 |  avq     6.50 |               |  avio 0.26 ms |
NET | transport     | tcpi      11  | tcpo      17  | udpi       4 |  udpo       8 |  tcpao      3 | tcppo      0  |               | tcprs      3  | tcpie      0 |  tcpor      0 |  udpnp      0 |  udpie      0 |
NET | network       | ipi       20  |               | ipo       33 |  ipfrw      0 |  deliv     20 |               |               |               |              |  icmpi      5 |               |  icmpo      0 |
NET | enp0s3    0%  | pcki      11  | pcko      28  | sp 1000 Mbps |  si    1 Kbps |  so    1 Kbps |               | coll       0  | mlti       0  | erri       0 |  erro       0 |  drpi       0 |  drpo       0 |
NET | lo      ----  | pcki       9  | pcko       9  | sp    0 Mbps |  si    0 Kbps |  so    0 Kbps |               | coll       0  | mlti       0  | erri       0 |  erro       0 |  drpi       0 |  drpo       0 |

   PID        TID     MINFLT      MAJFLT     VSTEXT      VSLIBS      VDATA      VSTACK      VSIZE       RSIZE      PSIZE       VGROW      RGROW      SWAPSZ     RUID          EUID          MEM      CMD        1/1
  2536          -        941           0       188K      127.3M     551.2M        144K       2.3G      281.2M         0K          0K       344K       6556K     daygeek       daygeek       14%      Web Content
  2464          -         75           0       188K      187.7M     680.6M        132K       2.3G      226.6M         0K          0K       212K      42088K     daygeek       daygeek       11%      firefox
  2039          -       4199           6        16K      163.6M     423.0M        132K       3.5G      220.2M         0K          0K      2936K      109.6M     daygeek       daygeek       11%      gnome-shell
 10822          -          1           0         4K      16680K     377.0M        132K       3.4G      193.4M         0K          0K         0K          0K     root          root          10%      java
Method-14 : Using htop Command
htop is an interactive process viewer for Linux which was developed by Hisham using ncurses library. Htop have many of features and options compared to top command.
Suggested Read : Monitor system resources using Htop command
$ htop

  1  [|||||||||||||                                                                             13.0%]   Tasks: 152, 587 thr; 1 running
  2  [|||||||||||||||||||||||||                                                                 25.0%]   Load average: 0.91 2.03 2.66
  Mem[||||||||||||||||||||||||||||||||||||||||||||||||||||||||||||||||||||||||||||||||||||1.66G/1.95G]   Uptime: 01:14:53
  Swp[||||||                                                                               782M/12.4G]

  PID USER      PRI  NI  VIRT   RES   SHR S CPU% MEM%   TIME+  Command
 2039 daygeek    20   0 3541M  214M 46728 S 36.6 10.8 22:36.77 /usr/bin/gnome-shell
 2045 daygeek    20   0 3541M  214M 46728 S 10.3 10.8  3:02.92 /usr/bin/gnome-shell
 2046 daygeek    20   0 3541M  214M 46728 S  8.3 10.8  3:04.96 /usr/bin/gnome-shell
 6080 daygeek    20   0  807M 37228 24352 S  2.1  1.8  0:11.99 /usr/lib/gnome-terminal/gnome-terminal-server
 2880 daygeek    20   0 2205M  164M 17048 S  2.1  8.3  7:16.50 /usr/lib/firefox/firefox -contentproc -childID 6 -isForBrowser -intPrefs 6:50|7:-1|19:0|34:1000|42:20|43:5|44:10|51:0|57:128|58:10000|63:0|65:400|66
 6125 daygeek    20   0 1916M  159M 92352 S  2.1  8.0  2:09.14 /usr/lib/firefox/firefox -contentproc -childID 7 -isForBrowser -intPrefs 6:50|7:-1|19:0|34:1000|42:20|43:5|44:10|51:0|57:128|58:10000|63:0|65:400|66
 2536 daygeek    20   0 2335M  243M 26792 S  2.1 12.2  6:25.77 /usr/lib/firefox/firefox -contentproc -childID 1 -isForBrowser -intPrefs 6:50|7:-1|19:0|34:1000|42:20|43:5|44:10|51:0|57:128|58:10000|63:0|65:400|66
 2653 daygeek    20   0 2237M  185M 20788 S  1.4  9.3  3:01.76 /usr/lib/firefox/firefox -contentproc -childID 4 -isForBrowser -intPrefs 6:50|7:-1|19:0|34:1000|42:20|43:5|44:10|51:0|57:128|58:10000|63:0|65:400|66
Method-15 : Using corefreq Utility
CoreFreq is a CPU monitoring software designed for Intel 64-bits Processors and supported architectures are Atom, Core2, Nehalem, SandyBridge and superior, AMD Family 0F.
CoreFreq provides a framework to retrieve CPU data with a high degree of precision.
Suggested Read : CoreFreq – A Powerful CPU monitoring Tool for Linux Systems
$ ./corefreq-cli -k
Linux:
|- Release                                                   [4.13.0-37-generic]
|- Version                          [#42-Ubuntu SMP Wed Mar 7 14:13:23 UTC 2018]
|- Machine                                                              [x86_64]
Memory:
|- Total RAM                                                          2041396 KB
|- Shared RAM                                                           99620 KB
|- Free RAM                                                            108428 KB
|- Buffer RAM                                                            8108 KB
|- Total High                                                               0 KB
|- Free High                                                                0 KB
$ ./corefreq-cli -k | grep "Total RAM" | awk '{print $4 / 1024 }'
1993.55
$ ./corefreq-cli -k | grep "Total RAM" | awk '{print $4 / 1024 / 1024}'
1.94683
Method-16 : Using glances Command
Glances is a cross-platform curses-based system monitoring tool written in Python. We can say all in one place, like maximum of information in a minimum of space. It uses psutil library to get information from your system.
Glances capable to monitor CPU, Memory, Load, Process list, Network interface, Disk I/O, Raid, Sensors, Filesystem (and folders), Docker, Monitor, Alert, System info, Uptime, Quicklook (CPU, MEM, LOAD), etc,.
Suggested Read : Glances (All in one Place)– An Advanced Real Time System Performance Monitoring Tool for Linux
$ glances

ubuntu (Ubuntu 17.10 64bit / Linux 4.13.0-37-generic) - IP 192.168.1.6/24                                                                                                                           Uptime: 1:08:40

CPU  [||||||||||||||||||||||||||||||||||||||||||||||||||||||||||||||||||        90.6%]   CPU -    90.6%  nice:     0.0%  ctx_sw:    4K      MEM \   78.4%  active:     942M      SWAP -    5.9%      LOAD    2-core
MEM  [|||||||||||||||||||||||||||||||||||||||||||||||||||||||||                 78.0%]   user:    55.1%  irq:      0.0%  inter:   1797      total:  1.95G  inactive:   562M      total:   12.4G      1 min:    4.35
SWAP [||||                                                                       5.9%]   system:  32.4%  iowait:   1.8%  sw_int:   897      used:   1.53G  buffers:   14.8M      used:     749M      5 min:    4.38
                                                                                         idle:     7.6%  steal:    0.0%                     free:    431M  cached:     273M      free:    11.7G      15 min:   3.38

NETWORK     Rx/s   Tx/s   TASKS 211 (735 thr), 4 run, 207 slp, 0 oth sorted automatically by memory_percent, flat view
docker0       0b   232b
enp0s3      12Kb    4Kb   Systemd          7    Services loaded: 197 active: 196 failed: 1
lo          616b   616b
_h478e48e     0b   232b     CPU%  MEM%  VIRT   RES   PID USER        NI S     TIME+   R/s   W/s Command
                            63.8  18.9 2.33G  377M  2536 daygeek      0 R   5:57.78     0     0 /usr/lib/firefox/firefox -contentproc -childID 1 -isForBrowser -intPrefs 6:50|7:-1|19:0|34:1000|42:20|43:5|44:10|51
DefaultGateway     83ms     78.5  10.9 3.46G  217M  2039 daygeek      0 S  21:07.46     0     0 /usr/bin/gnome-shell
                             8.5  10.1 2.32G  201M  2464 daygeek      0 S   8:45.69     0     0 /usr/lib/firefox/firefox -new-window
DISK I/O     R/s    W/s      1.1   8.5 2.19G  170M  2653 daygeek      0 S   2:56.29     0     0 /usr/lib/firefox/firefox -contentproc -childID 4 -isForBrowser -intPrefs 6:50|7:-1|19:0|34:1000|42:20|43:5|44:10|51
dm-0           0      0      1.7   7.2 2.15G  143M  2880 daygeek      0 S   7:10.46     0     0 /usr/lib/firefox/firefox -contentproc -childID 6 -isForBrowser -intPrefs 6:50|7:-1|19:0|34:1000|42:20|43:5|44:10|51
sda1       9.46M    12K      0.0   4.9 1.78G 97.2M  6125 daygeek      0 S   1:36.57     0     0 /usr/lib/firefox/firefox -contentproc -childID 7 -isForBrowser -intPrefs 6:50|7:-1|19:0|34:1000|42:20|43:5|44:10|51
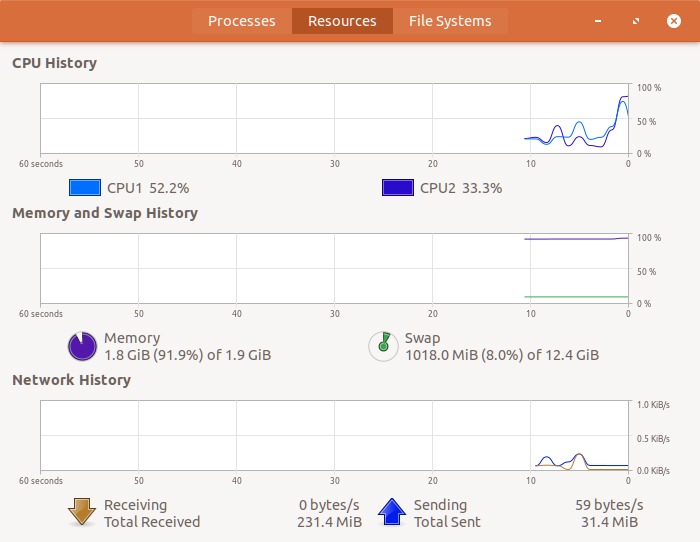
Method-17 : Using gnome-system-monitor
System Monitor is a tool to manage running processes and monitor system resources. It shows you what programs are running and how much processor time, memory, and disk space are being used.