Linux is not like Windows and you will not get a GUI always, especially in a server environment.
As a Linux administrator, it is important to know how to check your available and used resources, such as memory, CPU, disk space, etc.
If there are any applications that use too much resources on the system to run your system at the optimum level you need to find and fix.
If you want to find out the top 10 memory (RAM) consumption processes in Linux, go to the following article.
In Linux, there are commands for everything, so use the corresponding commands.
In this tutorial, we will show you eight powerful commands to check memory usage on a Linux system, including RAM and swap.
Creating swap space on a Linux system is very important.
The following commands can help you check memory usage in Linux in different ways.
- free Command
- /proc/meminfo File
- vmstat Command
- ps_mem Command
- smem Command
- top Command
- htop Command
- glances Command
1) How to Check Memory Usage on Linux Using the free Command
Free command is the most powerful command widely used by the Linux administrator. But it provides very little information compared to the “/proc/meminfo” file.
Free command displays the total amount of free and used physical and swap memory on the system, as well as buffers and caches used by the kernel.
These information is gathered from the “/proc/meminfo” file.
# free -m
              total        used        free      shared  buff/cache   available
Mem:          15867        9199        1702        3315        4965        3039
Swap:         17454         666       16788
- total: Total installed memory
- used: Memory is currently in use by running processes (used= total – free – buff/cache)
- free: Unused memory (free= total – used – buff/cache)
- shared: Memory shared between two or more processes (multiple processes)
- buffers: Memory reserved by the kernel to hold a process queue request.
- cache: Size of the page cache that holds recently used files in RAM
- buff/cache: Buffers + Cache
- available: Estimation of how much memory is available for starting new applications, without swapping.
2) How to Check Memory Usage on Linux Using the /proc/meminfo File
The “/proc/meminfo” file is a virtual file that contains various real-time information about memory usage.
It shows memory stats in kilobytes, most of which are somewhat difficult to understand.
However it contains useful information about memory usage.
# cat /proc/meminfo

MemTotal:       16248572 kB
MemFree:         1764576 kB
MemAvailable:    3136604 kB
Buffers:          234132 kB
Cached:          4731288 kB
SwapCached:        28516 kB
Active:          9004412 kB
Inactive:        3552416 kB
Active(anon):    8094128 kB
Inactive(anon):  2896064 kB
Active(file):     910284 kB
Inactive(file):   656352 kB
Unevictable:          80 kB
Mlocked:              80 kB
SwapTotal:      17873388 kB
SwapFree:       17191328 kB
Dirty:               252 kB
Writeback:             0 kB
AnonPages:       7566736 kB
Mapped:          3692368 kB
Shmem:           3398784 kB
Slab:             278976 kB
SReclaimable:     125480 kB
SUnreclaim:       153496 kB
KernelStack:       23936 kB
PageTables:        73880 kB
NFS_Unstable:          0 kB
Bounce:                0 kB
WritebackTmp:          0 kB
CommitLimit:    25997672 kB
Committed_AS:   24816804 kB
VmallocTotal:   34359738367 kB
VmallocUsed:           0 kB
VmallocChunk:          0 kB
Percpu:             3392 kB
HardwareCorrupted:     0 kB
AnonHugePages:         0 kB
ShmemHugePages:        0 kB
ShmemPmdMapped:        0 kB
HugePages_Total:       0
HugePages_Free:        0
HugePages_Rsvd:        0
HugePages_Surp:        0
Hugepagesize:       2048 kB
Hugetlb:               0 kB
DirectMap4k:     1059088 kB
DirectMap2M:    14493696 kB
DirectMap1G:     2097152 kB
3) How to Check Memory Usage on Linux Using the vmstat Command
The vmstat command is another useful tool for reporting virtual memory statistics.
vmstat reports information about processes, memory, paging, block IO, traps, disks, and cpu functionality.
vmstat does not require special permissions, and it can help identify system bottlenecks.
# vmstat

procs -----------memory---------- ---swap-- -----io---- -system-- ------cpu-----
 r  b   swpd   free   buff  cache   si   so    bi    bo   in   cs us sy id wa st
 1  0 682060 1769324 234188 4853500  0    3    25    91   31   16 34 13 52  0  0
If you want to understand this in detail, read the field description below.
Procs
- r: The number of runnable processes (running or waiting for run time).
- b: The number of processes in uninterruptible sleep.
Memory
- swpd: the amount of virtual memory used.
- free: the amount of idle memory.
- buff: the amount of memory used as buffers.
- cache: the amount of memory used as cache.
- inact: the amount of inactive memory. (-a option)
- active: the amount of active memory. (-a option)
Swap
- si: Amount of memory swapped in from disk (/s).
- so: Amount of memory swapped to disk (/s).
IO
- bi: Blocks received from a block device (blocks/s).
- bo: Blocks sent to a block device (blocks/s).
System
- in: The number of interrupts per second, including the clock.
- cs: The number of context switches per second.
CPU : These are percentages of total CPU time.
- us: Time spent running non-kernel code. (user time, including nice time)
- sy: Time spent running kernel code. (system time)
- id: Time spent idle. Prior to Linux 2.5.41, this includes IO-wait time.
- wa: Time spent waiting for IO. Prior to Linux 2.5.41, included in idle.
- st: Time stolen from a virtual machine. Prior to Linux 2.6.11, unknown.
Run the following command for detailed information.
# vmstat -s

        16248580 K total memory
         2210256 K used memory
         2311820 K active memory
         2153352 K inactive memory
        11368812 K free memory
          107584 K buffer memory
         2561928 K swap cache
        17873388 K total swap
               0 K used swap
        17873388 K free swap
           44309 non-nice user cpu ticks
             164 nice user cpu ticks
           14332 system cpu ticks
          382418 idle cpu ticks
            1248 IO-wait cpu ticks
            1407 IRQ cpu ticks
            2147 softirq cpu ticks
               0 stolen cpu ticks
         1022437 pages paged in
          260296 pages paged out
               0 pages swapped in
               0 pages swapped out
         1424838 interrupts
         4979524 CPU context switches
      1577163147 boot time
            3318 forks
4) How to Check Memory Usage on Linux Using the ps_mem Command
ps_mem is a simple Python script that allows you to get core memory usage accurately for a program in Linux.
This can determine how much RAM is used per program (not per process).
It calculates the total amount of memory used per program, total = sum (private RAM for program processes) + sum (shared RAM for program processes).
The shared RAM is problematic to calculate, and the tool automatically selects the most accurate method available for the running kernel.
# ps_mem

 Private  +   Shared  =  RAM used    Program
180.0 KiB +  30.0 KiB = 210.0 KiB    xf86-video-intel-backlight-helper (2)
192.0 KiB +  66.0 KiB = 258.0 KiB    cat (2)
312.0 KiB +  38.5 KiB = 350.5 KiB    lvmetad
380.0 KiB +  25.5 KiB = 405.5 KiB    crond
392.0 KiB +  32.5 KiB = 424.5 KiB    rtkit-daemon
852.0 KiB + 117.0 KiB = 969.0 KiB    gnome-session-ctl (2)
928.0 KiB +  56.5 KiB = 984.5 KiB    gvfs-mtp-volume-monitor
  1.0 MiB +  42.5 KiB =   1.0 MiB    dconf-service
  1.0 MiB + 106.5 KiB =   1.1 MiB    gvfs-goa-volume-monitor
  1.0 MiB + 180.5 KiB =   1.2 MiB    gvfsd
.
.
  5.3 MiB +   3.0 MiB =   8.3 MiB    evolution-addressbook-factory
  8.5 MiB +   1.2 MiB =   9.7 MiB    gnome-session-binary (4)
  7.5 MiB +   3.1 MiB =  10.5 MiB    polkitd
  7.4 MiB +   3.3 MiB =  10.7 MiB    pulseaudio (2)
  7.0 MiB +   7.0 MiB =  14.0 MiB    msm_notifier
 12.7 MiB +   2.3 MiB =  15.0 MiB    evolution-source-registry
 13.3 MiB +   2.5 MiB =  15.8 MiB    gnome-terminal-server
 15.8 MiB +   1.0 MiB =  16.8 MiB    tracker-miner-fs
 18.7 MiB +   1.8 MiB =  20.5 MiB    python3.7
 16.6 MiB +   4.0 MiB =  20.5 MiB    evolution-calendar-factory
 22.3 MiB + 753.0 KiB =  23.0 MiB    gsd-keyboard (2)
 22.4 MiB + 832.0 KiB =  23.2 MiB    gsd-wacom (2)
 20.8 MiB +   2.5 MiB =  23.3 MiB    blueman-tray
 22.0 MiB +   1.8 MiB =  23.8 MiB    blueman-applet
 23.1 MiB + 934.0 KiB =  24.0 MiB    gsd-xsettings (2)
 23.7 MiB +   1.2 MiB =  24.9 MiB    gsd-media-keys (2)
 23.4 MiB +   1.6 MiB =  25.0 MiB    gsd-color (2)
 23.9 MiB +   1.2 MiB =  25.1 MiB    gsd-power (2)
 16.5 MiB +   8.9 MiB =  25.4 MiB    evolution-alarm-notify
 27.2 MiB +   2.0 MiB =  29.2 MiB    systemd-journald
 28.7 MiB +   2.8 MiB =  31.5 MiB    c
 29.6 MiB +   2.2 MiB =  31.8 MiB    chrome-gnome-sh (2)
 43.9 MiB +   6.8 MiB =  50.7 MiB    WebExtensions
 46.7 MiB +   6.7 MiB =  53.5 MiB    goa-daemon
 86.5 MiB +  55.2 MiB = 141.7 MiB    Xorg (2)
191.4 MiB +  24.1 MiB = 215.4 MiB    notepadqq-bin
306.7 MiB +  29.0 MiB = 335.7 MiB    gnome-shell (2)
601.6 MiB +  77.7 MiB = 679.2 MiB    firefox
  1.0 GiB + 109.7 MiB =   1.1 GiB    chrome (15)
  2.3 GiB + 123.1 MiB =   2.5 GiB    Web Content (8)
----------------------------------
                           5.6 GiB
==================================
5) How to Check Memory Usage on Linux Using the smem Command
smem is a tool that can provide numerous reports of memory usage on Linux systems. Unlike existing tools, smem can report Proportional Set Size (PSS), Unique Set Size (USS) and Resident Set Size (RSS).
Proportional Set Size (PSS): refers to the amount of memory used by libraries and applications in the virtual memory system.
Unique Set Size (USS) : Unshared memory is reported as USS (Unique Set Size).
Resident Set Size (RSS) : The standard measure of physical memory (it typically shared among multiple applications) usage known as resident set size (RSS) will significantly overestimate memory usage.
# smem -tk

 PID User     Command                         Swap      USS      PSS      RSS
3383 daygeek  cat                                0    92.0K   123.0K     1.7M
3384 daygeek  cat                                0   100.0K   129.0K     1.7M
1177 daygeek  /usr/lib/gnome-session-ctl         0   436.0K   476.0K     4.6M
1171 daygeek  /usr/bin/dbus-daemon --conf        0   524.0K   629.0K     3.8M
1238 daygeek  /usr/lib/xdg-permission-sto        0   592.0K   681.0K     5.9M
1350 daygeek  /usr/lib/gsd-screensaver-pr        0   652.0K   701.0K     5.8M
1135 daygeek  /usr/lib/gdm-x-session --ru        0   648.0K   723.0K     6.0M
.
.
1391 daygeek  /usr/lib/evolution-data-ser        0    16.5M    25.2M    63.3M
1416 daygeek  caffeine-ng                        0    28.7M    31.4M    66.2M
4855 daygeek  /opt/google/chrome/chrome -        0    38.3M    46.3M   120.6M
2174 daygeek  /usr/lib/firefox/firefox -c        0    44.0M    50.7M   120.3M
1254 daygeek  /usr/lib/goa-daemon                0    46.7M    53.3M    80.4M
3416 daygeek  /opt/google/chrome/chrome -        0    44.7M    54.2M   103.3M
4782 daygeek  /opt/google/chrome/chrome -        0    57.2M    65.8M   142.3M
1137 daygeek  /usr/lib/Xorg vt2 -displayf        0    77.2M   129.6M   192.3M
3376 daygeek  /opt/google/chrome/chrome          0   117.8M   131.0M   210.9M
4448 daygeek  /usr/lib/firefox/firefox -c        0   124.4M   133.8M   224.1M
3558 daygeek  /opt/google/chrome/chrome -        0   157.3M   165.7M   242.2M
2310 daygeek  /usr/lib/firefox/firefox -c        0   159.6M   169.4M   259.6M
4331 daygeek  /usr/lib/firefox/firefox -c        0   176.8M   186.2M   276.8M
4034 daygeek  /opt/google/chrome/chrome -        0   179.3M   187.9M   264.6M
3911 daygeek  /opt/google/chrome/chrome -        0   183.1M   191.8M   269.4M
3861 daygeek  /opt/google/chrome/chrome -        0   199.8M   208.2M   285.2M
2746 daygeek  /usr/bin/../lib/notepadqq/n        0   193.5M   217.5M   261.5M
1194 daygeek  /usr/bin/gnome-shell               0   203.7M   219.0M   285.1M
2945 daygeek  /usr/lib/firefox/firefox -c        0   294.5M   308.0M   410.2M
2786 daygeek  /usr/lib/firefox/firefox -c        0   341.2M   354.3M   459.1M
4193 daygeek  /usr/lib/firefox/firefox -c        0   417.4M   427.6M   519.3M
2651 daygeek  /usr/lib/firefox/firefox -c        0   417.0M   430.1M   535.6M
2114 daygeek  /usr/lib/firefox/firefox -c        0   430.6M   473.9M   610.9M
2039 daygeek  /usr/lib/firefox/firefox --        0   601.3M   677.5M   840.6M
-------------------------------------------------------------------------------
  90 1                                           0     4.8G     5.2G     8.0G
6) How to Check Memory Usage on Linux Using the top Command
top command is one of the most frequently used commands by Linux administrators to understand and view the resource usage for a process on a Linux system.
It displays the total memory of the system, current memory usage, free memory and total memory used by the buffers.
In addition, it displays total swap memory, current swap usage, free swap memory, and total cached memory by the system.
# top -b | head -10

top - 11:04:39 up 40 min,  1 user,  load average: 1.59, 1.42, 1.28
Tasks: 288 total,   2 running, 286 sleeping,   0 stopped,   0 zombie
%Cpu(s): 13.3 us,  1.5 sy,  0.0 ni, 84.4 id,  0.0 wa,  0.3 hi,  0.5 si,  0.0 st
KiB Mem : 16248572 total,  7755928 free,  4657736 used,  3834908 buff/cache
KiB Swap: 17873388 total, 17873388 free,        0 used.  9179772 avail Mem

  PID USER      PR  NI    VIRT    RES    SHR S  %CPU  %MEM     TIME+ COMMAND
 2114 daygeek   20     3182736 616624 328228 R  83.3   3.8   7:09.72 Web Content
 2039 daygeek   20     4437952 849616 261364 S  13.3   5.2   7:58.54 firefox
 1194 daygeek   20     4046856 291288 165460 S   4.2   1.8   1:57.68 gnome-shell
 4034 daygeek   20      808556 273244  88676 S   4.2   1.7   1:44.72 chrome
 2945 daygeek   20     3309832 416572 150112 S   3.3   2.6   4:04.60 Web Content
 1137 daygeek   20      564316 197292 183380 S   2.5   1.2   2:55.76 Xorg
 2651 daygeek   20     3098420 547260 275700 S   1.7   3.4   2:15.96 Web Content
 2786 daygeek   20     2957112 463912 240744 S   1.7   2.9   3:22.29 Web Content
    1 root      20      182756  10208   7760 S   0.8   0.1   0:04.51 systemd
  442 root     -51                           S   0.8         0:05.02 irq/141-iw+
 1426 daygeek   20      373660  48948  29820 S   0.8   0.3   0:03.55 python3
 2174 daygeek   20     2466680 122196  78604 S   0.8   0.8   0:17.75 WebExtensi+
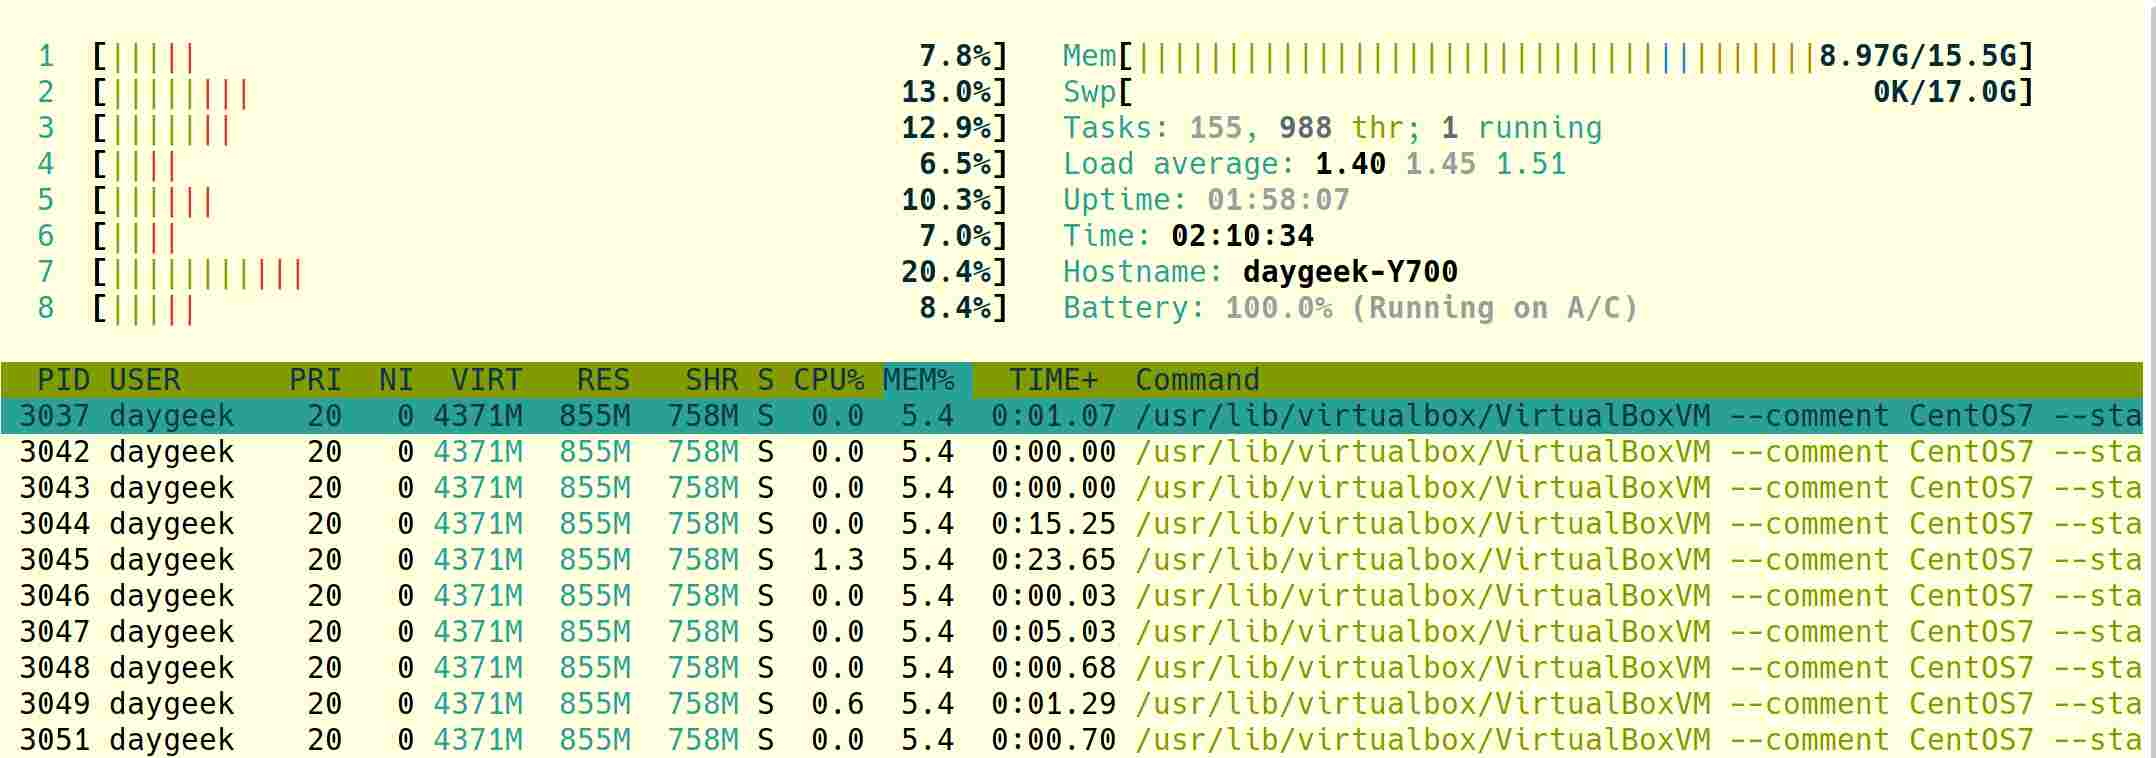
7) How to Check Memory Usage on Linux Using the htop Command
The htop command is an interactive process viewer for Linux/Unix systems. It is a text-mode application and requires the ncurses library, it was developed by Hisham.
It is designed as an alternative to the top command.
This is similar to the top command, but allows you to scroll vertically and horizontally to see all the processes running the system.
htop comes with Visual Colors, which have added benefits and are very evident when it comes to tracking system performance.
You are free to carry out any tasks related to processes, such as process killing and renicing without entering their PIDs.
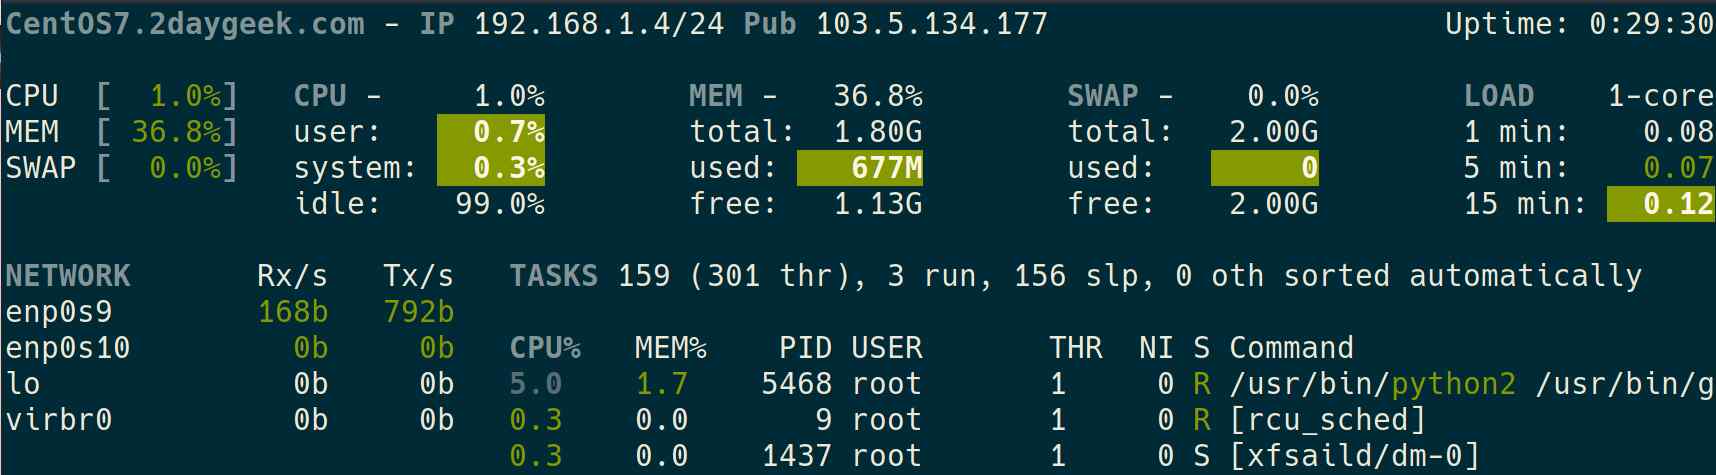
8) How to Check Memory Usage on Linux Using the glances Command
Glances is a cross-platform system monitoring tool written in Python.
You can see all information in one place such as CPU usage, Memory usage, running process, Network interface, Disk I/O, Raid, Sensors, Filesystem info, Docker, System info, Uptime, etc,.