Analyzing a log file is a big headache for Linux administrators as it’s capturing a lot of things.Most of the newbies and L1 administrators doesn’t know how to analyze this.
If you have good knowledge to analyze a logs then you will be an expert for NIX system.
There are many tools available in Linux to analyze the logs easily.
GoAccess is one of the tool which allow users to analyze web server logs easily.We will be going to discuss in details about GoAccess tool in this article.
What is GoAccess?
GoAccess is a real-time web log analyzer and interactive viewer that runs in a terminal in *nix systems or through your browser.
GoAccess has minimal requirements, it’s written in C and requires only ncurses.
It will support Apache, Nginx and Lighttpd logs. It provides fast and valuable HTTP statistics for system administrators that require a visual server report on the fly.
GoAccess parses the specified web log file and outputs the data to the X terminal and browser.
GoAccess was designed to be a fast, terminal-based log analyzer. Its core idea is to quickly analyze and view web server statistics in real time without needing to use your browser.
Terminal output is the default output, it has the capability to generate a complete, self-contained, real-time HTML report, as well as a JSON, and CSV report.
GoAccess allows any custom log format and the following (Combined Log Format (XLF/ELF) Apache | Nginx & Common Log Format (CLF) Apache) predefined log format options are included, but not limited to.
GoAccess Features
Completely Real Time:All the metrics are updated every 200 ms on the terminal and every second on the HTML output.Track Application Response Time:Track the time taken to serve the request. Extremely useful if you want to track pages that are slowing down your site.Visitors:Determine the amount of hits, visitors, bandwidth, and metrics for slowest running requests by the hour, or date.Metrics per Virtual Host:Have multiple Virtual Hosts (Server Blocks)? It features a panel that displays which virtual host is consuming most of the web server resources.
How to install GoAccess?
I would recommend users to install GoAccess from distribution official repository with help of Package Manager. It is available in most of the distributions official repository.
As we know, we will be getting bit outdated package for standard release distribution and rolling release distributions always include latest package.
If you are running the OS with standard release distributions, I would suggest you to check the alternative options such as PPA or Official GoAccess maintainer repository, etc, to get a latest package.
For Debian/Ubuntu systems, use APT-GET Command or APT Command to install GoAccess on your systems.
# apt install goaccess
To get a latest GoAccess package, use the below GoAccess official repository.
$ echo "deb https://deb.goaccess.io/ $(lsb_release -cs) main" | sudo tee -a /etc/apt/sources.list.d/goaccess.list
$ wget -O - https://deb.goaccess.io/gnugpg.key | sudo apt-key add -
$ sudo apt-get update
$ sudo apt-get install goaccess
For RHEL/CentOS systems, use YUM Package Manager to install GoAccess on your systems.
# yum install goaccess
For Fedora system, use DNF Package Manager to install GoAccess on your system.
# dnf install goaccess
For ArchLinux/Manjaro based systems, use Pacman Package Manager to install GoAccess on your systems.
# pacman -S goaccess
For openSUSE Leap system, use Zypper Package Manager to install GoAccess on your system.
# zypper install goaccess

# zypper ar -f obs://server:http

# zypper ref && zypper in goaccess
How to use GoAccess?
After successful installation of GoAccess. Just enter the goaccess command and followed by the web server log location to view it.
# goaccess [options] /path/to/Web Server/access.log

# goaccess /var/log/apache/2daygeek_access.log
When you execute the above command, it will ask you to select the Log Format Configuration.
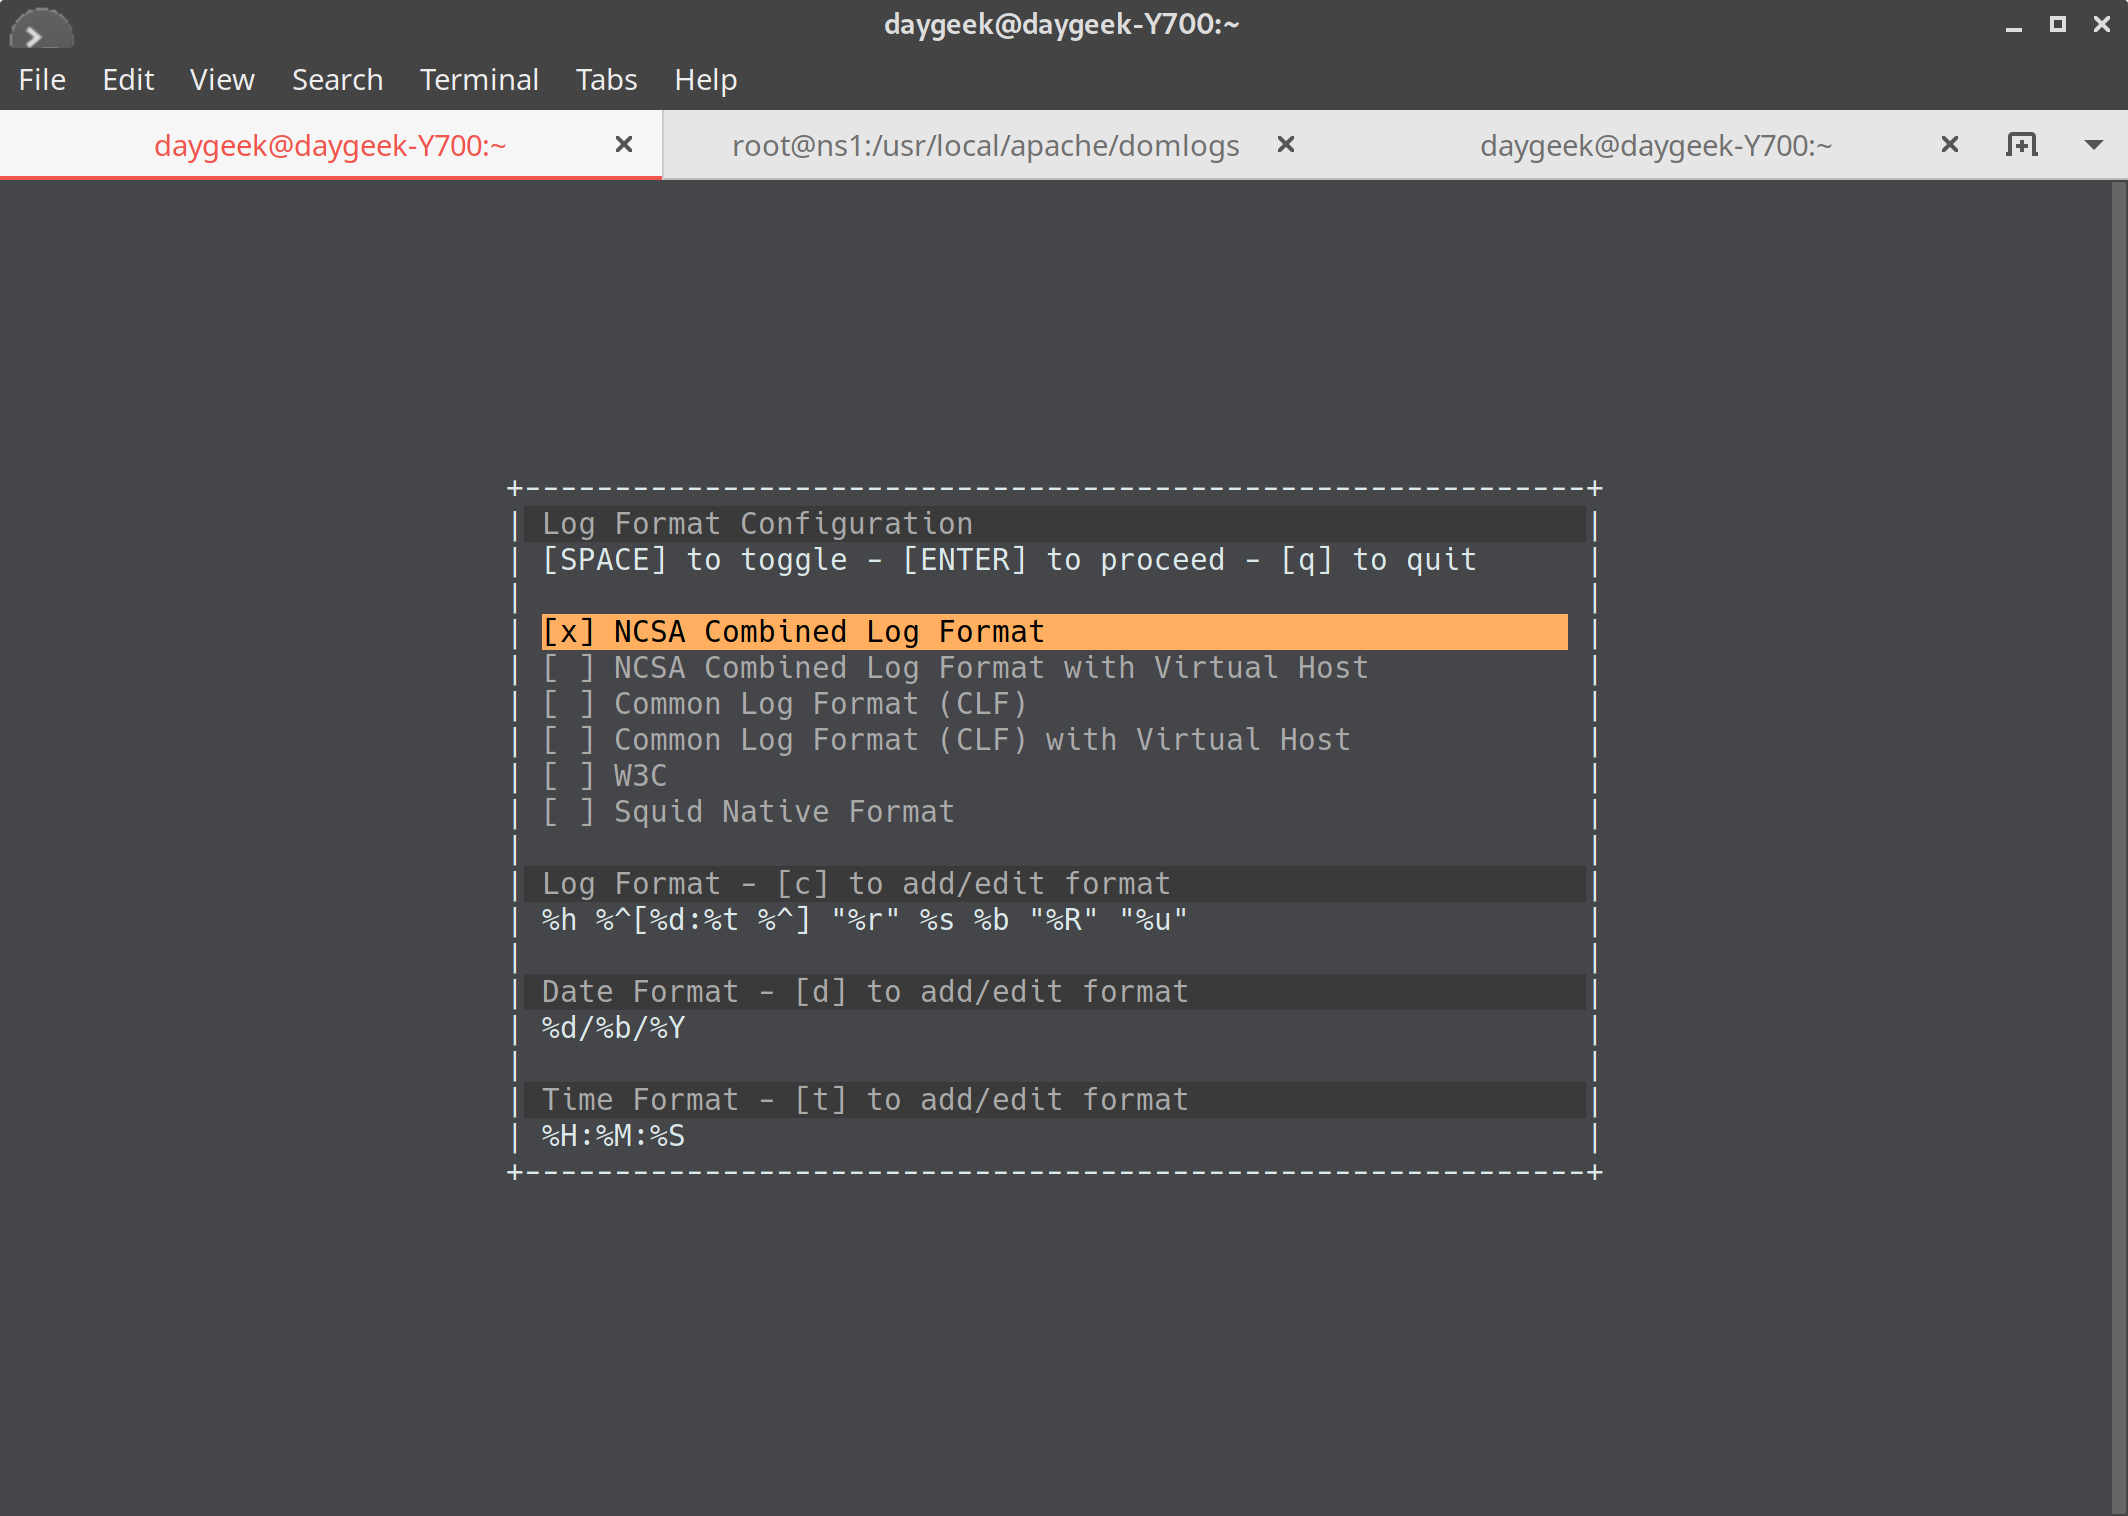
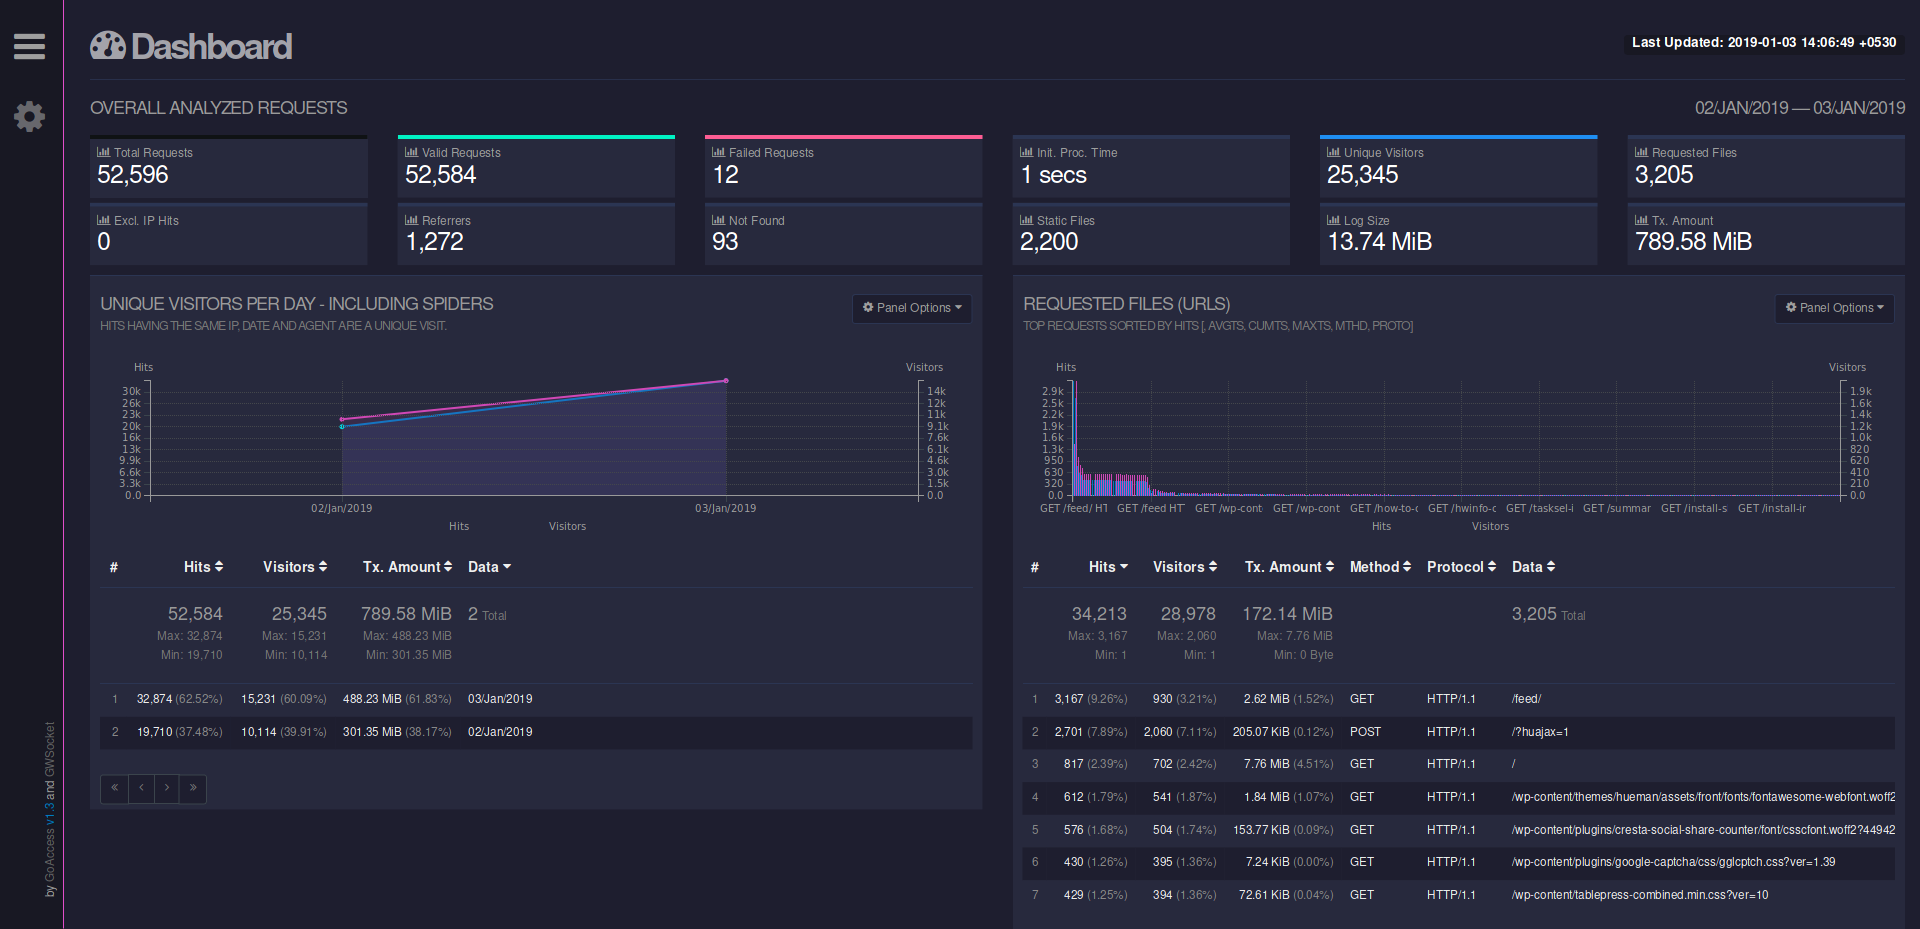
I had tested this with Apache access log. The Apache log is split in fifteen section. The details are below. The main section shows the summary about the fifteen section.
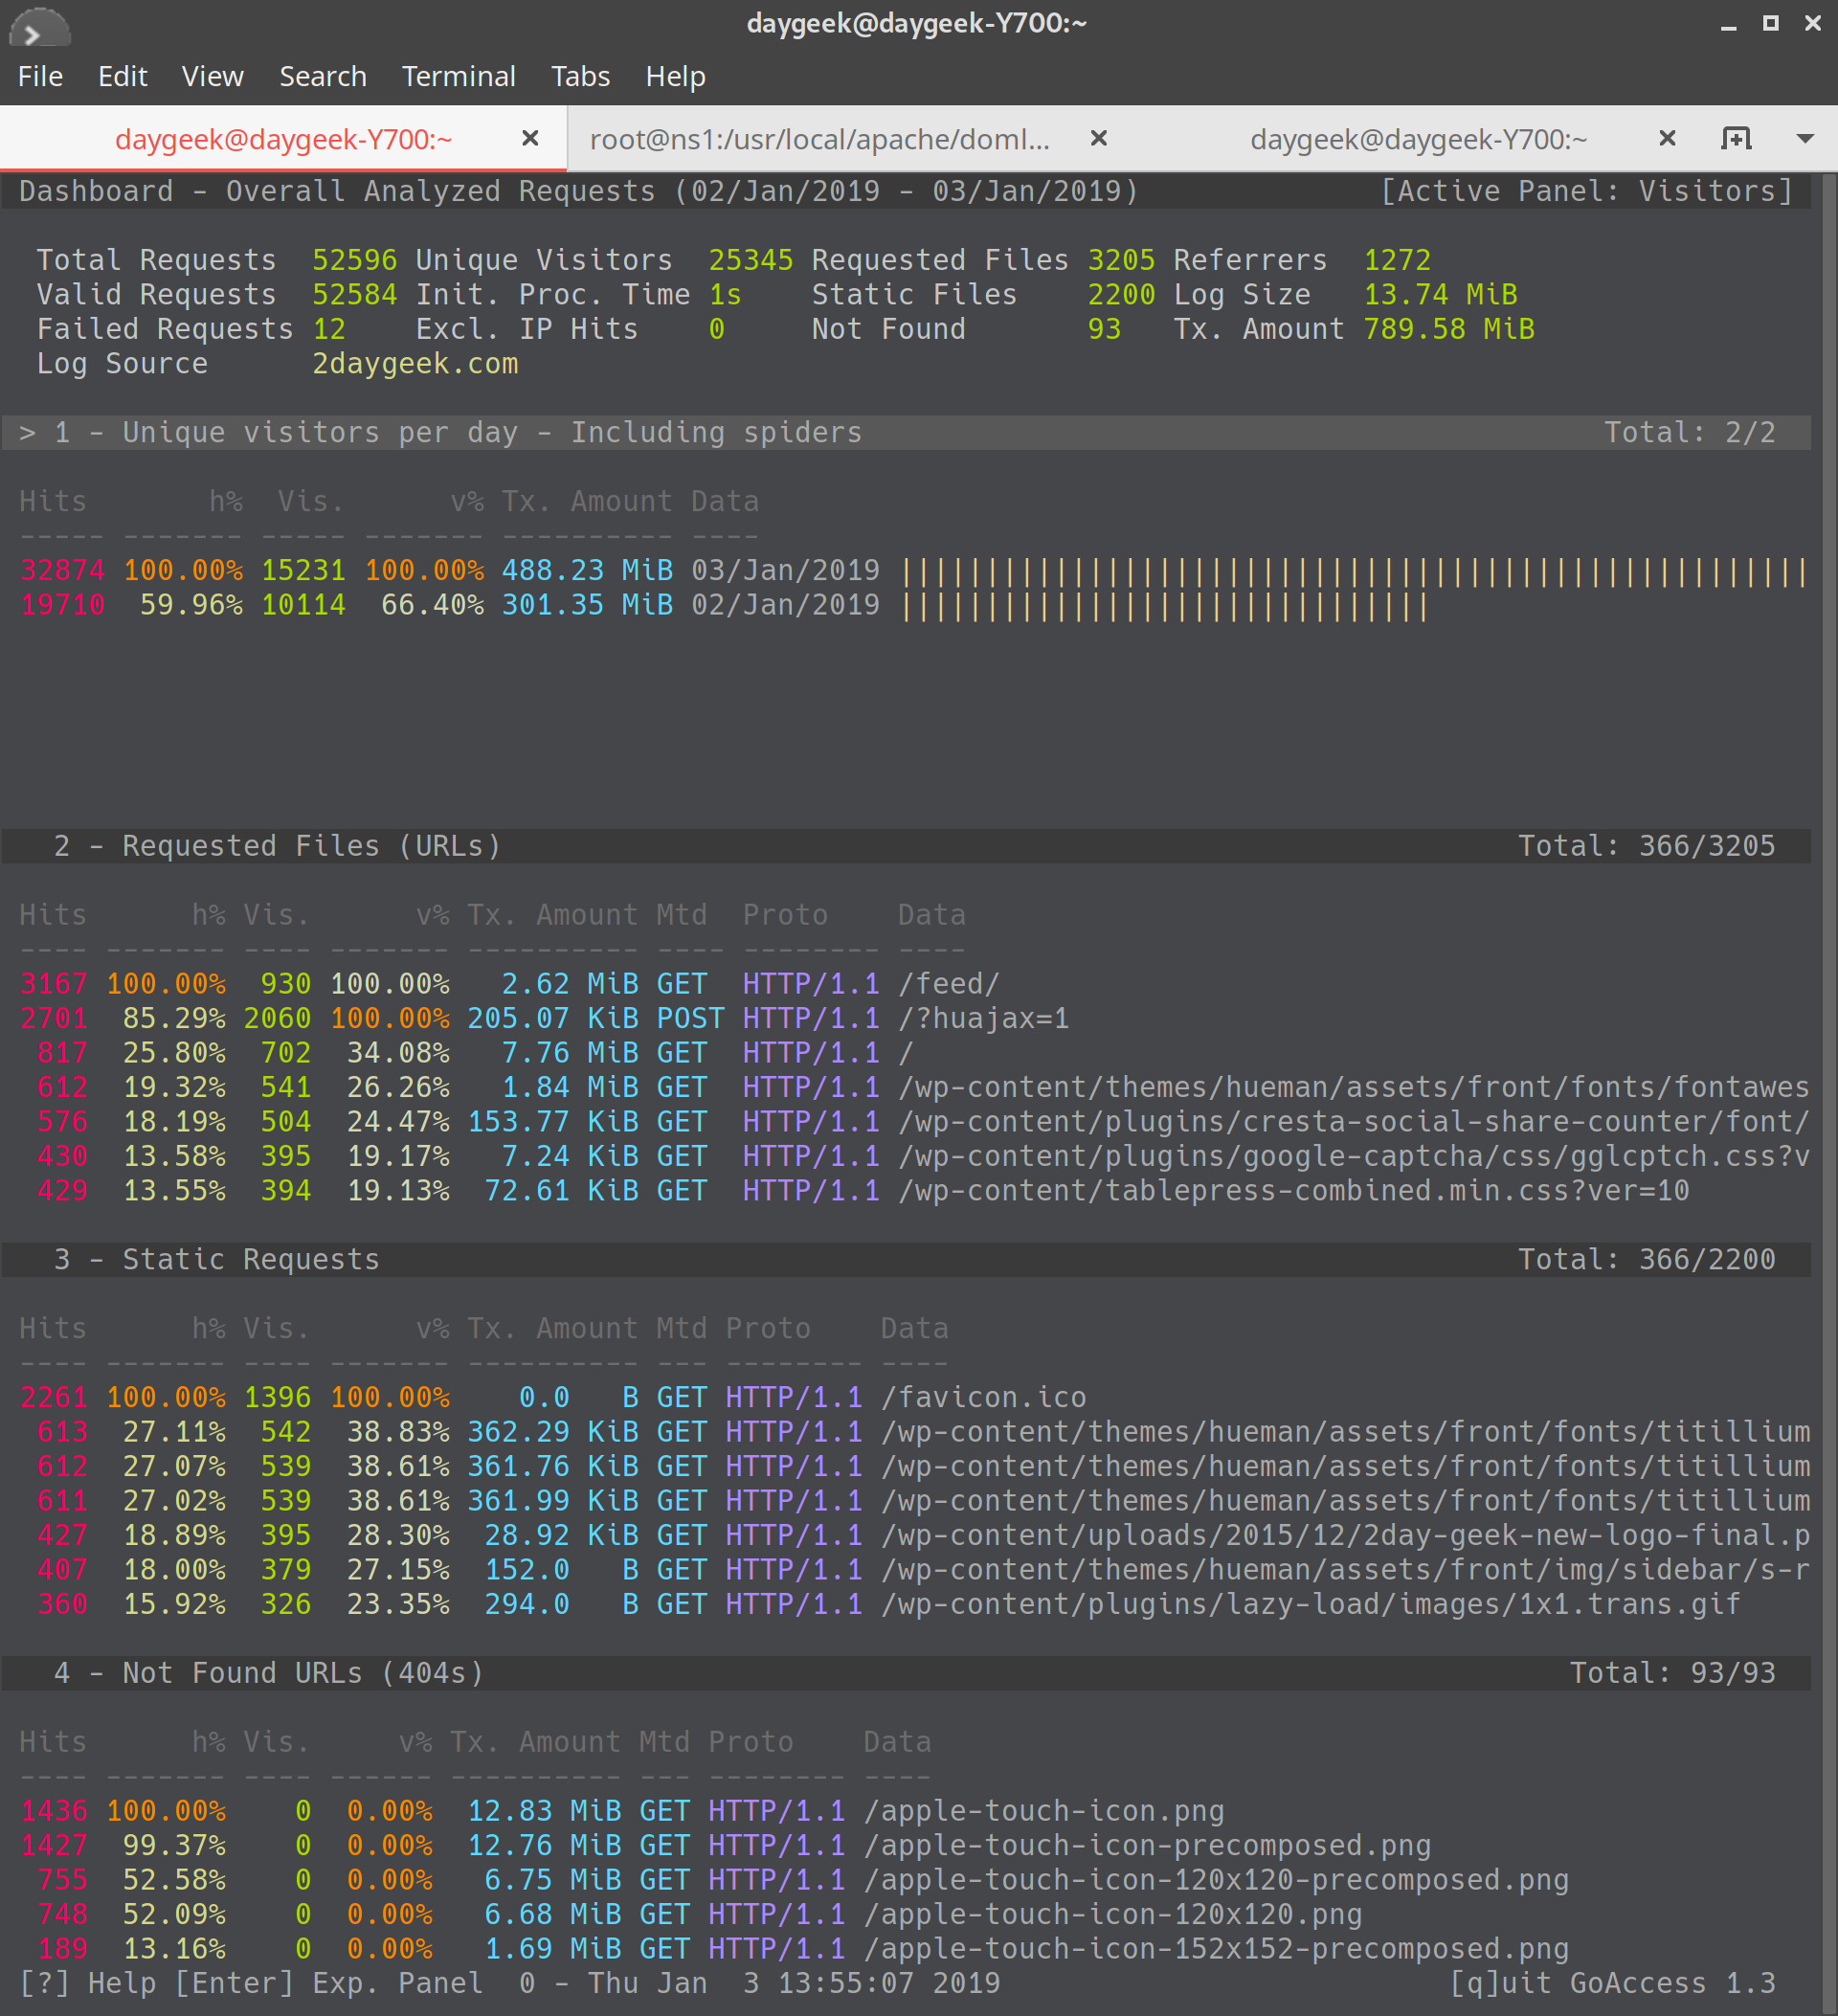
The below screenshots included four sessions such as Unique Visitors, Requested files, Static Requests, Not found URLs.
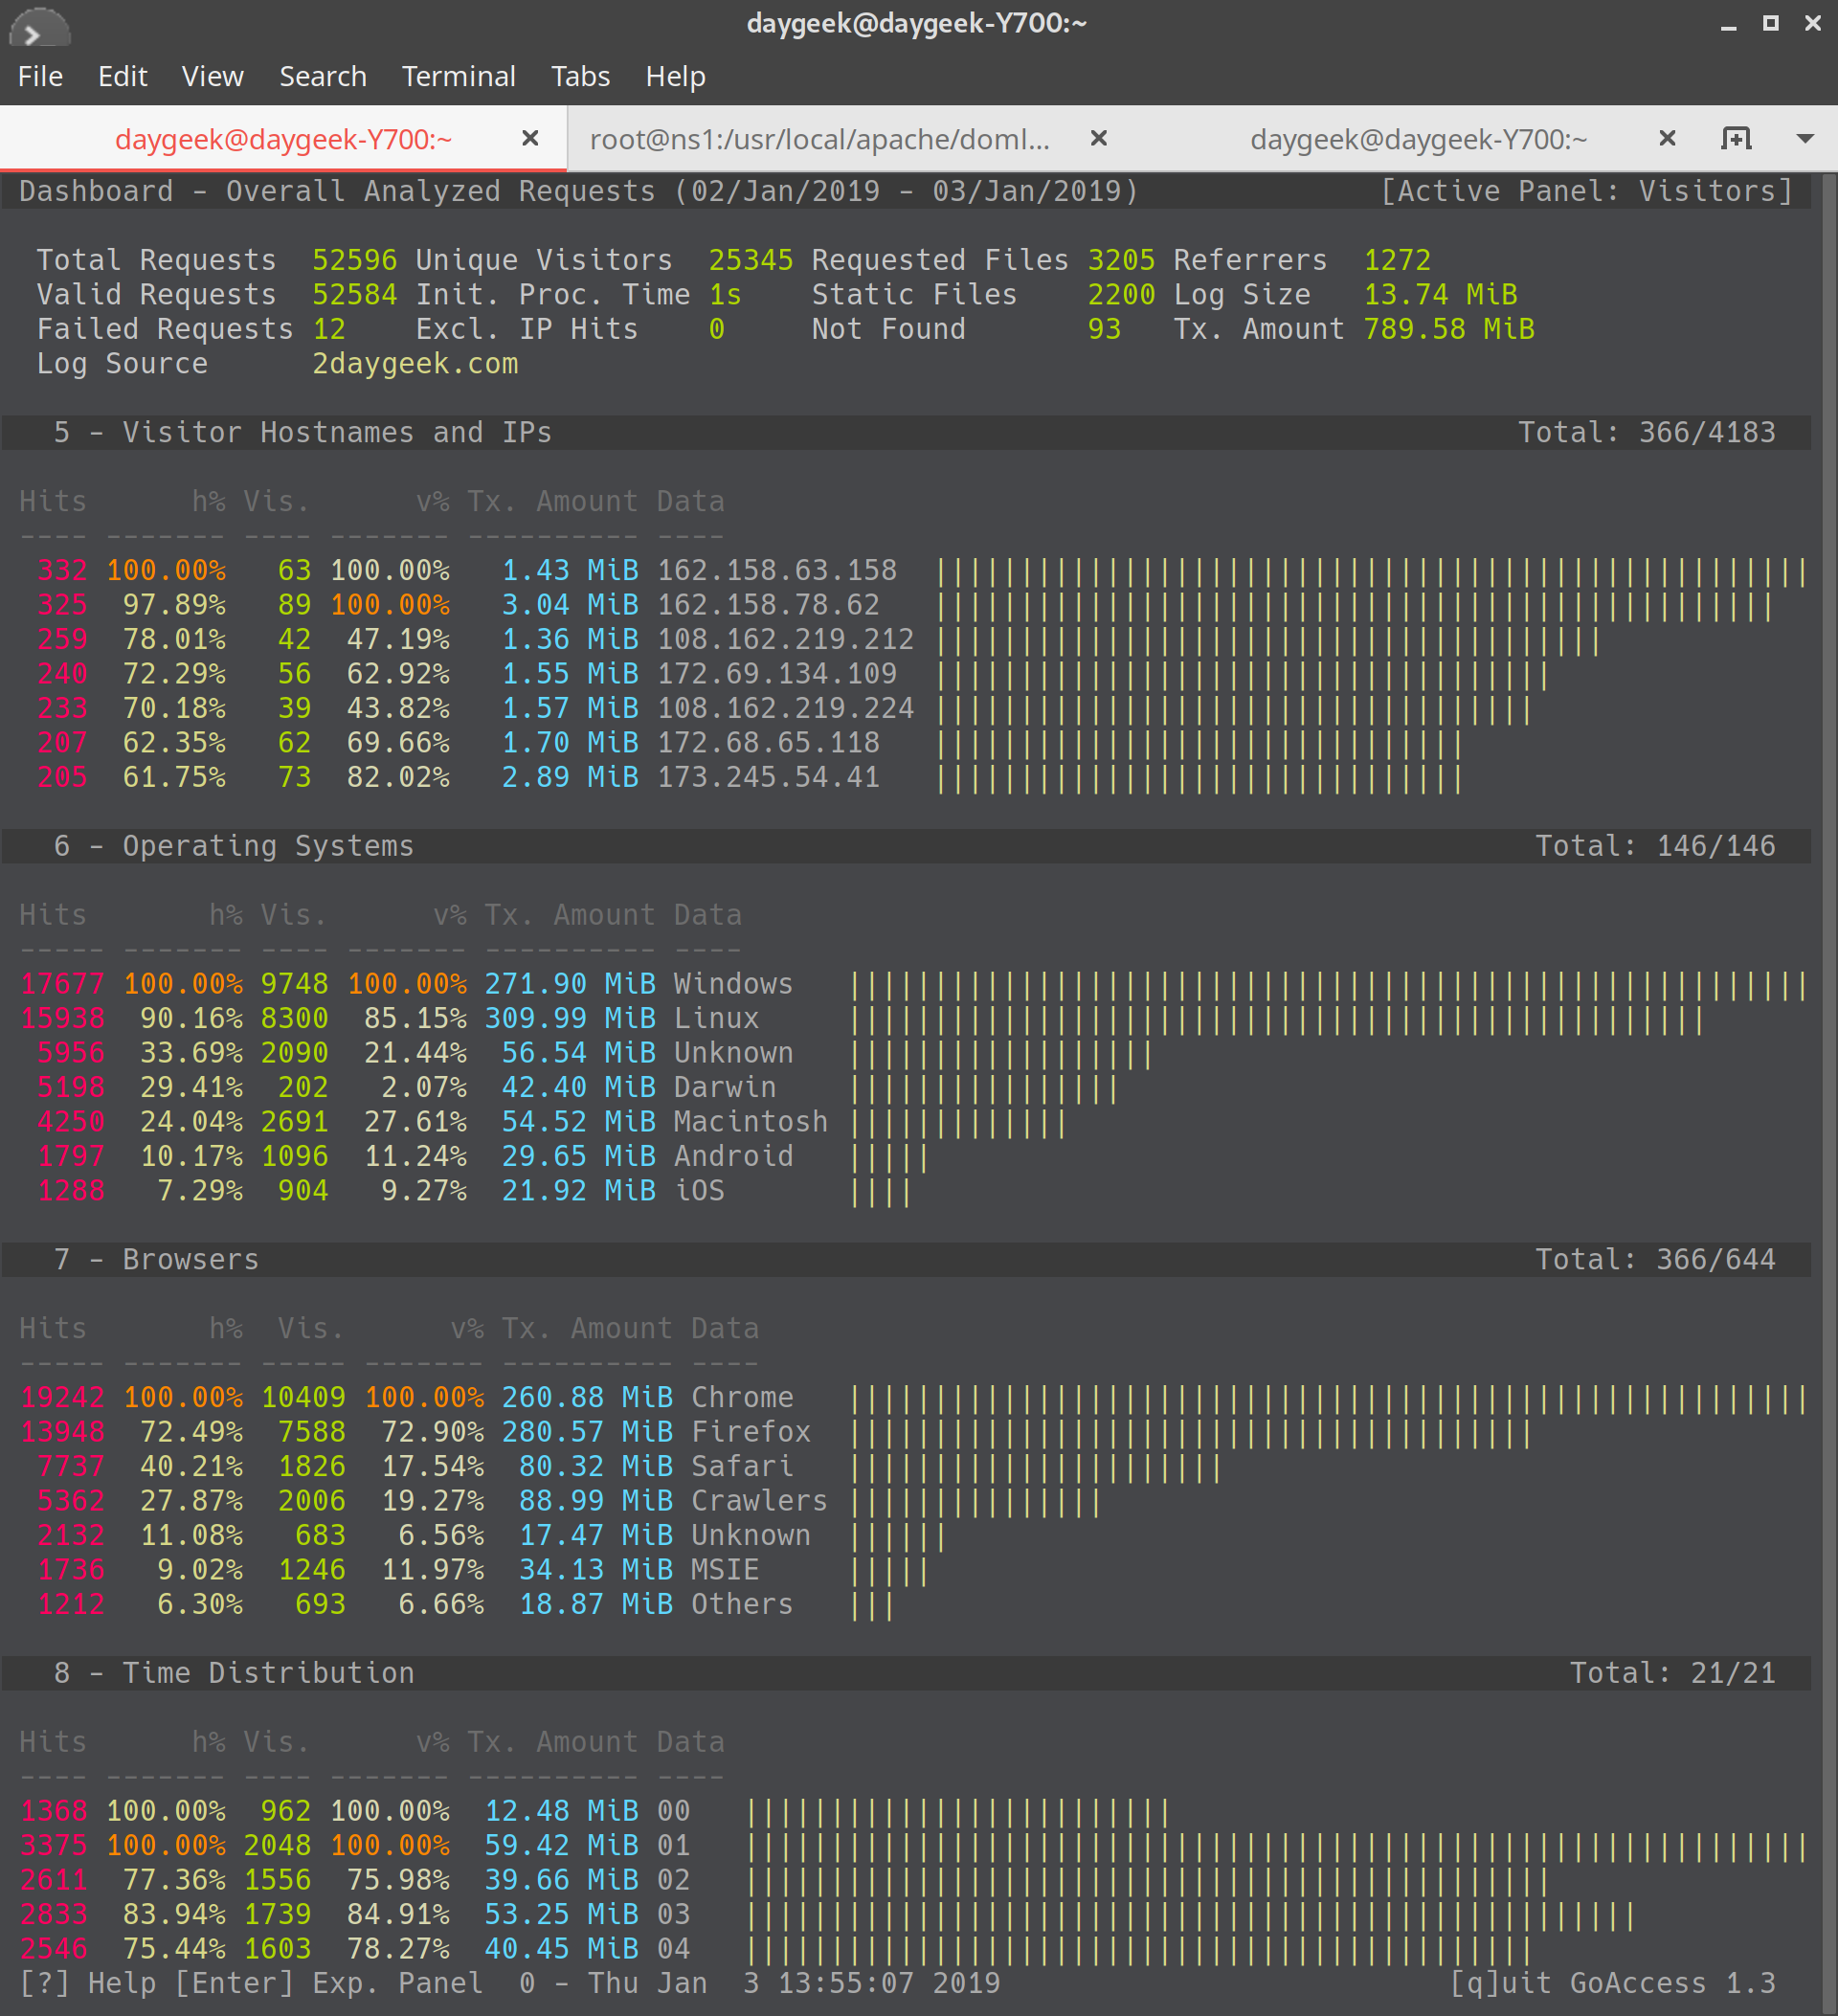
The below screenshots included four sessions such as Visitor Hostnames and IPs, Operating Systems, Browsers, Time Distribution.
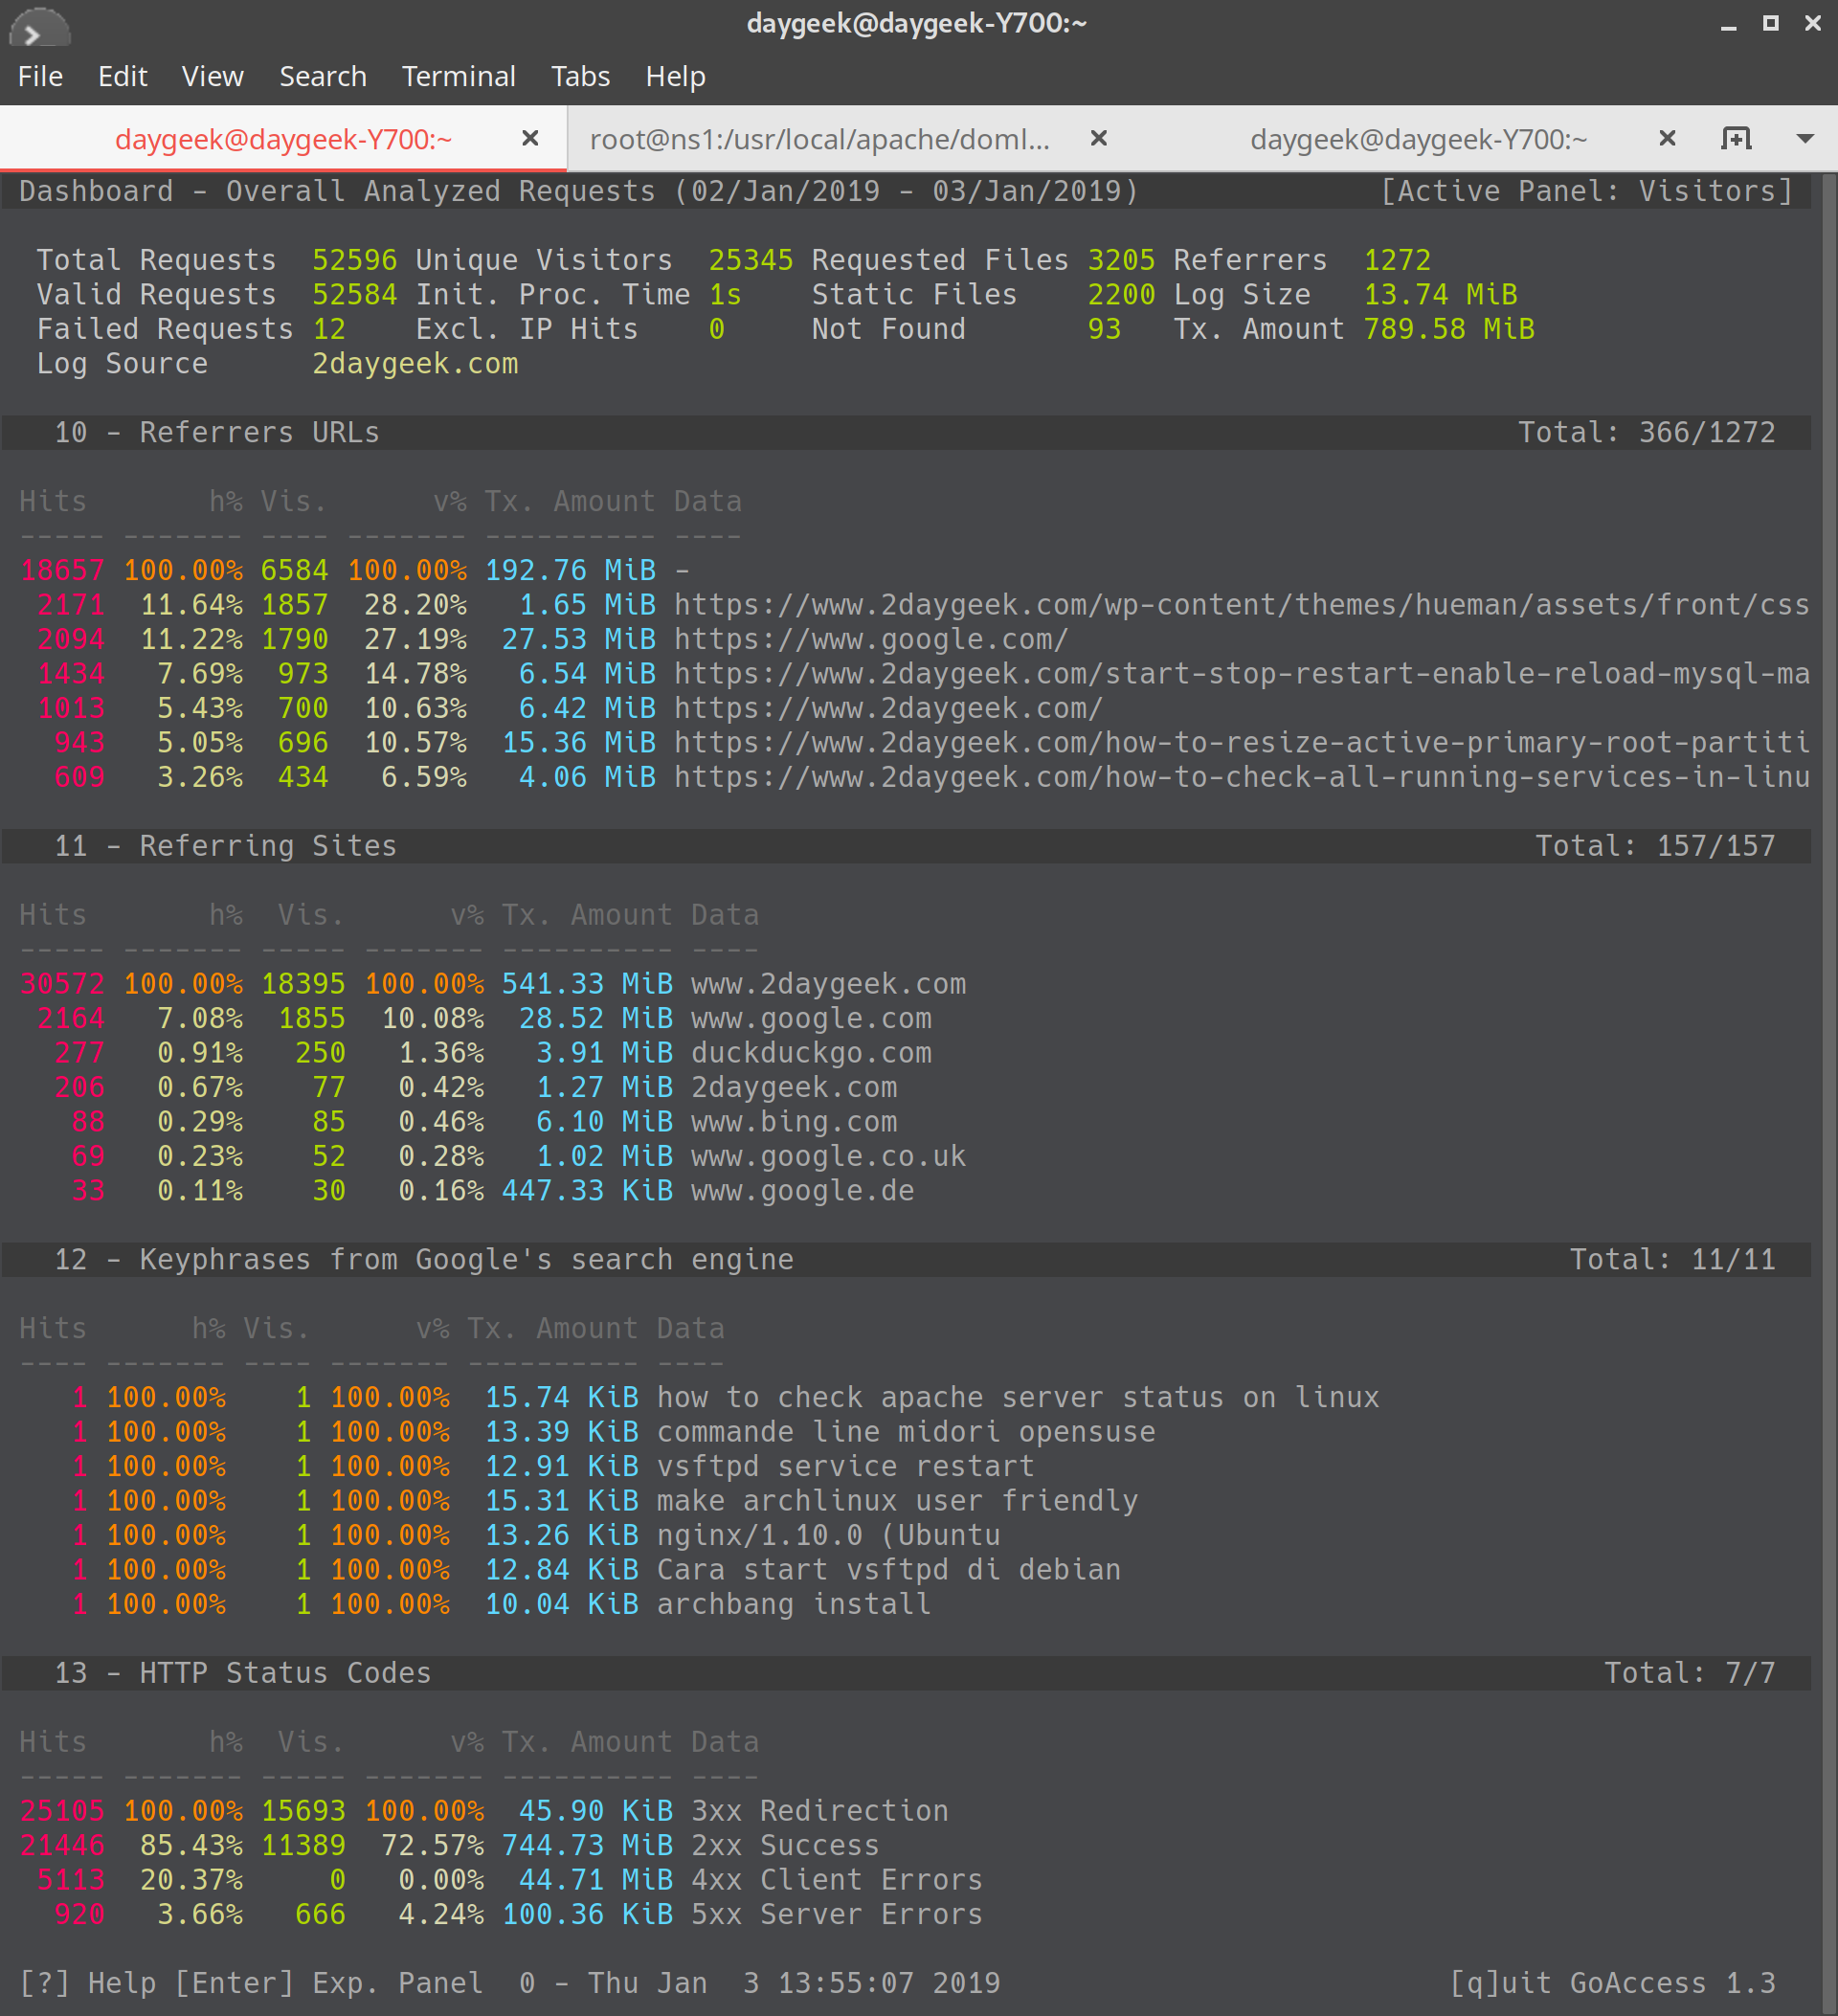
The below screenshots included four sessions such as Referrers URLs, Referring Sites, Google’s search engine results, HTTP status codes.
If you would like to generate a html report, use the following format.
Initially I got an error when I was trying to generate the html report.
# goaccess 2daygeek_access.log -a > report.html

GoAccess - version 1.3 - Nov 23 2018 11:28:19
Config file: No config file used

Fatal error has occurred
Error occurred at: src/parser.c - parse_log - 2764
No time format was found on your conf file.Parsing... [0] [0/s]
It says “No time format was found on your conf file”. To overcome this issue, add the “COMBINED” log format option on it.
# goaccess -f 2daygeek_access.log --log-format=COMBINED -o 2daygeek.html
Parsing...[0,165] [50,165/s]
GoAccess allows you to access and analyze the real-time log filtering and parsing.
# tail -f /var/log/apache/2daygeek_access.log | goaccess -
For more details navigate to man or help page.
# man goaccess
or
# goaccess --help